pancho_hideboo
Advanced Member level 5
- Joined
- Oct 21, 2006
- Messages
- 2,847
- Helped
- 767
- Reputation
- 1,536
- Reaction score
- 732
- Trophy points
- 1,393
- Location
- Real Homeless
- Activity points
- 17,490
We can plot a histogram in Cadence's Post Processing Environment based on Wavescan in ADE for results of Monte-Carlo Analysis.
However I don't know any function to plot histogram for general analysis data in Cadence's Post Processing Environment.
Ocean function, "histogram()" in Cadence's ADE is limited to results of Monte-Carlo Analysis.
On the other hand, we can easily plot histogram for any analysis data in other vendor's post processing environment.
Usually I use following three methods.
(1) we can easily plot histogram for any analysis data in Agilent's ADS post processing environment.
histogram() - ADS 2009 -*Agilent EEsof Documentation Center
The Designer's Guide Community Forum - Size Dependent Mismatch Variation's Description don't work in Agilent RFDE2006U3
(2) Also we can easily plot histogram for any analysis data in Synopsys's "Custom Waveview".
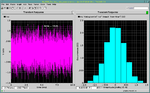
See attached figure.
This is a noise voltage by transient noise analysis of Cadence Spectre.
Horizontal axis is time and Vertical axis is amplitude in upper figure.
Lower figure is a histogram.
(3) As another option, we can plot histogram by Mathworks MATLAB.
In (2) and (3), we can use Cadence's "psf" data directly.
How do you plot histogram for general analysis data in Cadence's Post Processing Environment ?
Do I have to create custom skill function to build histogram from general analysis data ?
However I don't know any function to plot histogram for general analysis data in Cadence's Post Processing Environment.
Ocean function, "histogram()" in Cadence's ADE is limited to results of Monte-Carlo Analysis.
On the other hand, we can easily plot histogram for any analysis data in other vendor's post processing environment.
Usually I use following three methods.
(1) we can easily plot histogram for any analysis data in Agilent's ADS post processing environment.
histogram() - ADS 2009 -*Agilent EEsof Documentation Center
The Designer's Guide Community Forum - Size Dependent Mismatch Variation's Description don't work in Agilent RFDE2006U3
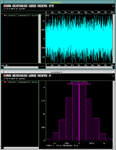
(2) Also we can easily plot histogram for any analysis data in Synopsys's "Custom Waveview".
See attached figure.
This is a noise voltage by transient noise analysis of Cadence Spectre.
Horizontal axis is time and Vertical axis is amplitude in upper figure.
Lower figure is a histogram.
(3) As another option, we can plot histogram by Mathworks MATLAB.
In (2) and (3), we can use Cadence's "psf" data directly.
How do you plot histogram for general analysis data in Cadence's Post Processing Environment ?
Do I have to create custom skill function to build histogram from general analysis data ?
Attachments
Last edited: