Continue to Site

Welcome to EDAboard.com

Welcome to our site! EDAboard.com is an international Electronics Discussion Forum focused on EDA software, circuits, schematics, books, theory, papers, asic, pld, 8051, DSP, Network, RF, Analog Design, PCB, Service Manuals... and a whole lot more! To participate you need to register. Registration is free. Click here to register now.

[SOLVED] Drawing simple Data in Smith ADS smith Chart

Status
Not open for further replies.
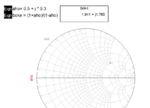
However ADS draws aho not boke.


ADS surely draws the exact input value on the chart simply.

I'm correct

ADS simply draws the complex input it self.

THESE ARE ALL WRONG! :bang:
Really! You are wrong. :bang:

you have posted a picture with no numbers on its axes!

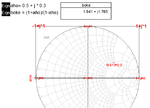
I've done the exact thing as you've done ( even your naming :-D ) but with axis data VISIBLE.
look the attachment!
look at numbers. It's BOKE! NOT AHO!! :bang:
It is drawing the corresponding Impedance of the input Reflection coefficient!


and forget about the Marker! It's Not and wasn't my case at all! No problem about the marker!

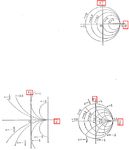
My Friend, Please take a precise look.
And
Surely send Results with Numbered Axes.

Smith Chart is a Graphical Representation of Complex Quantities so every kind of Complex Quantities can be read such as Impedance,Admittance,Reflection Coefficients,s-parameters etc.

I'm Total agree with what you said but our problem is not concerned with it.
We are simply arguing on whether ADS Smith Chart draws simply the input itself OR take the input as a reflection coefficient and draws its normalized corresponding Impedance! If you can help and try it once with your ADS, It will be a great help.
 

Attachments

  • Screen Shot 2019-06-18 at 6.36.29 PM.png
    Screen Shot 2019-06-18 at 6.36.29 PM.png
    72 KB · Views: 127

THESE ARE ALL WRONG! :bang:
Really! You are wrong. :bang:
You are still misunderstanding.
And you can not understand both ADS and Smith Chart at all.

look at numbers. It's BOKE! NOT AHO!! :bang:
Wrong.

Full circles and Partial circles are no more than sub grids for ADS Plot.
ADS plots data based on rectangle cordinates, (U, V).

lWe are simply arguing on whether ADS Smith Chart draws simply the input itself
ADS plots any complex value aho simply at location of U=0.5, V=0.3.

So ADS plots aho not boke.

Surely consider cordinate of aho.

Develop Data plot program on Smith Chart by Visual Basic or Visual C# by yourself.
You will understand how ADS plots data.
 

Attachments

  • 190619-000012.png
    190619-000012.png
    90.2 KB · Views: 125
  • 190619-002613.png
    190619-002613.png
    29.3 KB · Views: 114
Last edited:
  • Like
Reactions: Amir.Sk

    Amir.Sk

    Points: 2
    Helpful Answer Positive Rating
I did not noticed that you can read the both values at the same time. Interesting ! thank you for it!
So now we can say that each point on the smith chart simultaneously represents both a value of z and the corresponding value of reflection coefficient ! because if it was to just show the aho alone what was the purpose of Inventing such chart at all ?
thank you for your time

Thanks! :clap:
 

It seems that you can understand what you plot in a start of this thread, https://www.edaboard.com/showthread.php?384833#1
ADS simply plots minimum=0.1+j*0 and maximum=3.0+j*0.

It was very long road and very tired.

So now we can say that each point on the smith chart simultaneously represents both a value of z and the corresponding value of reflection coefficient !
It is well known as conformal mapping of bilinear transformation mathematically.

Relation between aho and boke is bilinear transformation.
aho=(boke-1)/(boke+1), boke=(1+aho)/(1-aho)

Main axis which ADS plots data is rectangular.
ADS plots any complex number aho simply not boke.
ADS don't care whatever aho is.
If you identify aho as reflection coefficient Γ, boke is normalized impedance z.

Horizontal axis corresponds to real(aho).
Vertical axis corresponds to imag(aho).

Full circles correspond to real(boke).
Partial circles correspond to imag(boke).

because if it was to just show the aho alone what was the purpose of Inventing such chart at all ?
Read text on Smith Chart Basics.

Assume to calculate boke=(1+aho)/(1-aho) by hand each time.
It will be very tired.

Long ago, there was no complex number calculator.
So calculation of bilinear transformation boke=(1+aho)/(1-aho) was difficult and tired task.

Full circles and partial circles eliminates needs of hand calculation of boke=(1+aho)/(1-aho).
This was a motivation of Smith Chart.

See the followings.
**broken link removed**
https://www.edaboard.com/showthread.php?369815
 
Last edited:
  • Like
Reactions: Amir.Sk

    Amir.Sk

    Points: 2
    Helpful Answer Positive Rating
Status
Not open for further replies.

Part and Inventory Search

Welcome to EDABoard.com

Sponsor

Back
Top