Welcome to our site! EDAboard.com is an international Electronics Discussion Forum focused on EDA software, circuits, schematics, books, theory, papers, asic, pld, 8051, DSP, Network, RF, Analog Design, PCB, Service Manuals... and a whole lot more! To participate you need to register. Registration is free. Click here to register now.
Hi. I want to ask how can i get phase margin and dc voltage gain from the graph? I'm really confused. Hopefully someone can help me with this. Thank you
The graph might allow to determine the phase margin, if it 1. shows the loop gain or can be converted to loop gain by considering a feedback factor and 2. extends to 0 dB gain
Then, can i know what is the right way to find the phase margin? I make mistake on finding the phase margin. Tq
- - - Updated - - -
I am confused whether the gain is at the starting or at -3db from the starting value. And for the phase margin, i make mistake on finding its value. Can i know the correct way to find it from my graph?
you need to extend the range of your graphs
you need to know where the gain graph crosses 0 dB, so the scale has to include 0 dB and you need to extend graph to see where it crosses
you need to know when the phase graph crosses -180 degrees, so extend the phase scale to include -180 degrees
you need to extend the frequency range to about 0.1 Hz to get a handle on DC gain
you need to extend the frequency scale to whatever you need so the gain crosses 0dB and the phase gets below -180 degrees
You do not need to see where phase crosses -180 degrees; you just need to see where gain crosses zero. The phase margin by definition is the difference of the phase at 0dB and -180 degrees.
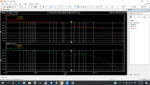
It seems like your DC gain is about 91dB but we cannot be so sure because your plot is shown from 100kHz. Plot again from 1Hz or 10Hz or even 100Hz.
We can't tell what your phase margin is because your plot doesn't show where the gain crosses the 0dB line. To obtain tge phase margin, extend your frequency up to 1MHz and measure the phase angle at gain of 0dB.
- - - Updated - - -
Oh! Your plot shows up to 1GHz already. Show the whole range of the plot up to say 100GHz or so.
This site uses cookies to help personalise content, tailor your experience and to keep you logged in if you register.
By continuing to use this site, you are consenting to our use of cookies.
")