Seleven
Newbie level 3
Hi there,
I simulated a EM tomography system with 32 antennas within a PEC cylinder. For the postprocessing I am interessted in the transmision parameters from the excited antenna (1) to antenna (X): SX1, at a single freqeuncy. I would like to plot the transmission in dB in dependence with the antenna number in the x axis.
Currently I extracting the data with General1D postprocessing templates as 0D data points. Thus for each transmission parameter a single template. Now i dont know how to create a plot with the transmission dependent on the corresponding antenna number. To clarify my desired output please refere to the attached image.
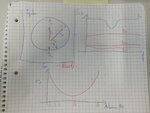
Left upper corner: the simulation model
Right upper corner: S11 and SX1 as function of frequency
Bottom: desired output of postprocessing
I am very unfamiliar with the postprocessing in CST. Does anybody have an idea how to accomplish this or should I directly export the data and use matlab for postprocessing?
Regards, Simon.
I simulated a EM tomography system with 32 antennas within a PEC cylinder. For the postprocessing I am interessted in the transmision parameters from the excited antenna (1) to antenna (X): SX1, at a single freqeuncy. I would like to plot the transmission in dB in dependence with the antenna number in the x axis.
Currently I extracting the data with General1D postprocessing templates as 0D data points. Thus for each transmission parameter a single template. Now i dont know how to create a plot with the transmission dependent on the corresponding antenna number. To clarify my desired output please refere to the attached image.
Left upper corner: the simulation model
Right upper corner: S11 and SX1 as function of frequency
Bottom: desired output of postprocessing
I am very unfamiliar with the postprocessing in CST. Does anybody have an idea how to accomplish this or should I directly export the data and use matlab for postprocessing?
Regards, Simon.