Welcome to our site! EDAboard.com is an international Electronics Discussion Forum focused on EDA software, circuits, schematics, books, theory, papers, asic, pld, 8051, DSP, Network, RF, Analog Design, PCB, Service Manuals... and a whole lot more! To participate you need to register. Registration is free. Click here to register now.
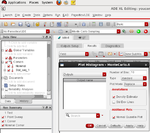
while seeing the histogram plot during Monte Carlo simulation, I'm not getting any output in histogram plot window please help me what and where is the problem
I attached the screenshot ...
I didn't know there is a window just to plot histograms. Smarter every day. Anyway, if you have results (calculated expressions) in "Yield" view of the results just click with right-mouse button on one and choose Plot Histogram. Or there is a histogram function in the Calculator, you can even calculate the standard deviation with an expression from the calculator.
If you still have a problem please be a bit more specific, what is the error log, or which is that step where you stucked. I don't get it why you cannot plot from above description.
In Cadence calculator the histogram function should work if you have a scalar data array, I used that already. I am not sure you have set any output.
- could you show your "Outputs Setup" tab and what you have set?
- the output expression is evaluated well in a nominal run?
tq for reply sir , yes in nominal run i am getting the output.
in calculator the histogram function is working but it works only for 1 itration ,i want for more than 1 iteration
that we can get from histogram which we will get from right-mouse click button on one and choose Plot Histogram
while right click i got histogram option but in that i am not geeting any output sir
please see the image
I tried all sir still am not getting sir
please check my screenshot
i defined in ADE also
only in histogram I'm not getting output.
thank you for the reply sir
You're doing a Transient Simulation, so you cannot obtain a scalar output.Transient simulation will give you wavetype output and this cannot be used in MC simulations.
All you can do is to accumulate the waves by a MC simulation,that's it but you try to obtain Histogram.
Again, could you show your "Outputs Setup" tab and what you have set as an expression?
What you have shown are signals in the waveform window, you need data points to plot them as a histogram.
To create the points you have to type an expression as output in the 'Output Setup' tab.
This site uses cookies to help personalise content, tailor your experience and to keep you logged in if you register.
By continuing to use this site, you are consenting to our use of cookies.