Continue to Site

Welcome to EDAboard.com

Welcome to our site! EDAboard.com is an international Electronics Discussion Forum focused on EDA software, circuits, schematics, books, theory, papers, asic, pld, 8051, DSP, Network, RF, Analog Design, PCB, Service Manuals... and a whole lot more! To participate you need to register. Registration is free. Click here to register now.

In which direction we need to go and read the reflection coefficient angles.

Status
Not open for further replies.

pusparaga

Full Member level 4
Joined
Oct 19, 2013
Messages
197
Helped
4
Reputation
8
Reaction score
4
Trophy points
1,298
Activity points
2,988
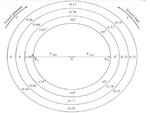
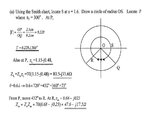
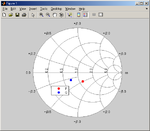
I need to find reflection coefficient angle = 300 degree using Smith chart. In which direction I need to go and find the angle 300 degree. There in Smith chart, they specified 0 to ± 180 degree, how to find 300 degree reflection coefficient angle using smith chart, please guide me. Herewith I attached Smith Chart angle diagram.
 

Attachments

  • Smith_Chart.jpg
    Smith_Chart.jpg
    43.8 KB · Views: 143

Problem is as follows
A 70 Ohm lossless line has s = 1.6 and reflection coefficient angle =300 degree. If the line is 0.6 lamda long, obtain (i) Reflection coefficient , Load impedance, and input impedance.
Answer is as follows, In the following image, he has taken 300 degree at "OQ" (marked it as 300 degree). How he took 300 degree, I am not understanding. Please tell how to take angles in Smith chart and how he marked 300 degree, it is correct only. Explain in elaborately.
 

Attachments

  • Solution.jpg
    Solution.jpg
    50.6 KB · Views: 315

Problem is as follows
It is too easy.

Can you understand basic complex algebra and transmission line theory ?

Code:
% https://www.edaboard.com/showthread.php?379848
% In-which-direction-we-need-to-go-and-read-the-reflection-coefficient-angles.

close all, clear all, clc
set(0, 'language', 'english')
colordef white; % Specify the plot background to be white

set(gcf, 'numbertitle', 'off')
set(gcf, 'MenuBar', 'none')

Rc = 70;

%S0 = 0.228 * exp(j*pi*300/180)
S0 = 0.228 * exp(j*pi*(-60)/180) % Point P

z0 = (1+S0) / (1-S0)
Z0 = Rc * z0

%beta = 2*pi/lambda
%L = 0.6*lambda
%S1 = S0 * exp(-j*2*beta*L)
%S1 = S0 * exp(-j*pi*432/180)
%S1 = 0.228 * exp(j*pi*(-492)/180)
S1 = 0.228 * exp(j*pi*(-132)/180) % Point R

z1 = (1+S1) / (1-S1)
Z1 = Rc * z1

S0_hid = smithchart(S0);
hold on
S1_hid = smithchart(S1);

legend('P', 'Q')

set(S0_hid, 'Marker', 'o')
set(S0_hid, 'MarkerSize', 6)
set(S0_hid, 'LineStyle', 'none')
set(S0_hid, 'MarkerFaceColor', 'r')
set(S0_hid, 'MarkerEdgeColor', 'r')

set(S1_hid, 'Marker', 'o')
set(S1_hid, 'MarkerSize', 6)
set(S1_hid, 'LineStyle', 'none')
set(S1_hid, 'MarkerFaceColor', 'b')
set(S1_hid, 'MarkerEdgeColor', 'b')

colordef black; % Specify the plot background to be black

Code:
S0 = 0.1140 - 0.1975i
z0 = 1.1505 - 0.4793i
Z0 = 80.5369 -33.5486i

S1 = -0.1526 - 0.1694i
z1 = 0.6986 - 0.2497i
Z1 = 48.8989 -17.4792i
 

Attachments

  • 180904-201744.png
    180904-201744.png
    12.9 KB · Views: 177
Last edited:

Status
Not open for further replies.

Part and Inventory Search

Welcome to EDABoard.com

Sponsor

Back
Top