Continue to Site

Welcome to EDAboard.com

Welcome to our site! EDAboard.com is an international Electronics Discussion Forum focused on EDA software, circuits, schematics, books, theory, papers, asic, pld, 8051, DSP, Network, RF, Analog Design, PCB, Service Manuals... and a whole lot more! To participate you need to register. Registration is free. Click here to register now.

power spectral density measurements

Status
Not open for further replies.

praveen450

Member level 5
Joined
May 13, 2011
Messages
89
Helped
0
Reputation
0
Reaction score
0
Trophy points
1,286
Activity points
1,957
Hello,

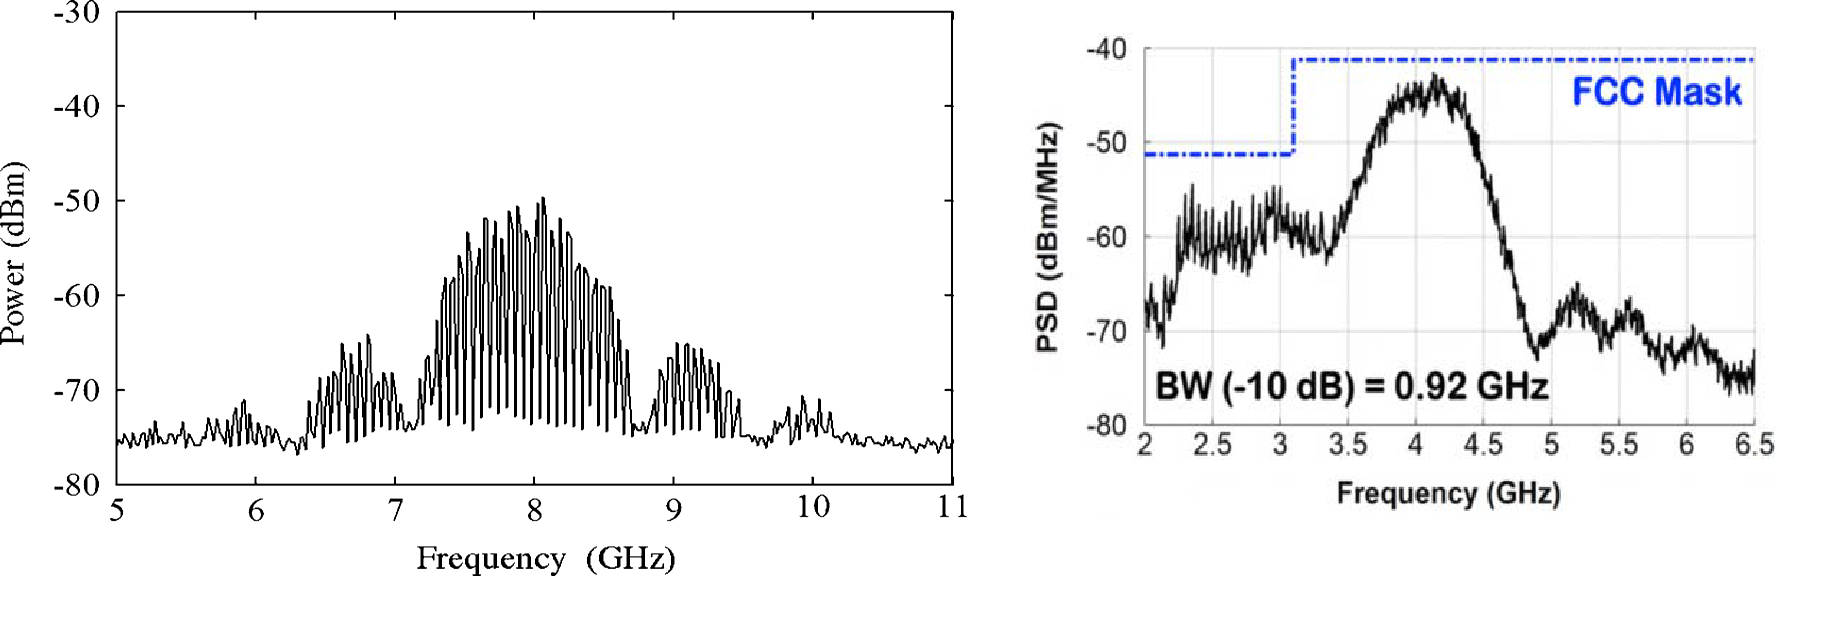
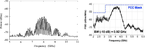
I'm looking in some ultra wideband papers where the PSD output is measured. In some papers, the output is very smooth and in some papers the output has lot of spectral components. Can anyone explain why this is happening?. I'm attaching two figures for reference. Both uses same type of modulation.

Thanks in advance.


Attachments

  • edaboard.png
    edaboard.png
    180.4 KB · Views: 69

FCC tests use quasi peak measurements with video filtering to resemble the bandwidth of audio spectra within the IF and video filter combined. The rationale was that EMI of carriers should not introduce audio noise in communication bands.

The video filter is a peak detect and slow decay filter on the sweep so that information on deep nulls is ignored.
The quasi means it is BW limited to ~20kHz on peak detect, so that ns/us peaks in carrier are filtered out if they exist.
 
Thank you for the information.

Do all spectrum analyzer have access to the video bandwidth?.
 

Status
Not open for further replies.

Part and Inventory Search

Welcome to EDABoard.com

Sponsor

Back
Top