Continue to Site

Welcome to EDAboard.com

Welcome to our site! EDAboard.com is an international Electronics Discussion Forum focused on EDA software, circuits, schematics, books, theory, papers, asic, pld, 8051, DSP, Network, RF, Analog Design, PCB, Service Manuals... and a whole lot more! To participate you need to register. Registration is free. Click here to register now.

Extracting currents or fields from hfss

Status
Not open for further replies.

MuroSamuro

Member level 4
Joined
Aug 18, 2016
Messages
79
Helped
2
Reputation
4
Reaction score
5
Trophy points
1,288
Activity points
1,936
hey there,

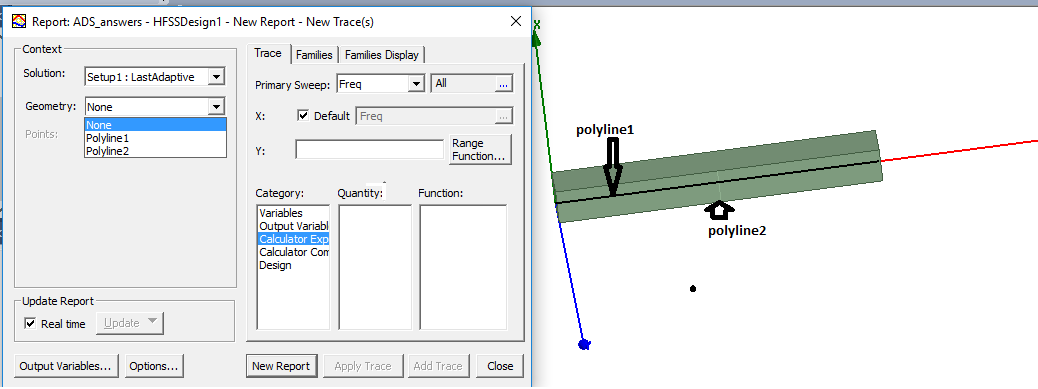
I made some hfss simulasions, and i want to extract some currents and field.

I would like to get a table of position and current (x,y,z, current)

Beacuse in the hfss itself i can only see graphs or colorized fields,

how is it possible?

thanks a lot!
 

If I am getting your problem correctly you want to export data of any plot in HFSS so that you can use it with some other software tool.
Just right click the plot and use Export command it will export the excel file of data of your plot
If issue is something else let me know
 
well,

My new problem is that When u go to plot rectangular plot and select a geometry, u can't select a 2d or 3d object,
only lines.
I want to get a plot of j_surf vs phi (as defined in cylindrical coordinates) over a torus, or even better, a table of valuses of abs j_surf vs phi.
I add here my simulationView attachment chiral particle.zip


thanks a lot!
 

Edit :

the file should be this one (the other one is not relevant)

thanks a lot!
 

Attachments

  • chiral.zip
    26.4 KB · Views: 72

well,

My new problem is that When u go to plot rectangular plot and select a geometry, u can't select a 2d or 3d object,
only lines.
thanks a lot!
What you really mean by this statement as with the rectangular plot you can plot the field on on any selected surface which is for sure 2d
Can you explain a bit more as I am not able to comprehend the problem at first place
 

What you really mean by this statement as with the rectangular plot you can plot the field on on any selected surface which is for sure 2d
Can you explain a bit more as I am not able to comprehend the problem at first place

here is a picture that will illustrate it for u,

i can select only polylin 1, and not the torus's surface
 

Attachments

  • pic.png
    pic.png
    355.8 KB · Views: 108

Hmmm I am not sure how you have made your geometry but in HFSS if you use polyline to make some geometry then it is always labeled as polyline what else you have in the geometry which is not appearing in the drop down list?
 

Hmmm I am not sure how you have made your geometry but in HFSS if you use polyline to make some geometry then it is always labeled as polyline what else you have in the geometry which is not appearing in the drop down list?

the geometry is not appearing in the drop down list.
 

Ok lets think in other way when we ask HFSS to create field report
HFSS>Results>create field Report>rectangular plot
what are we trying to plot as we have to keep one thing in mind that rectangular plot will be 2D plot where one dimension can be variation in any x,y or z dimension and other dimension could be intensity, phase or anything of our interest.
If it is the case then how a 2D or 3D object definition can adjust?
 

For sure, no.
Torus's surface, like any other surface is a 2D essence, but it varies in X Y and Z.

What i'm tring to say is that variation in X Y or Z alone, won't solve the problem.
 

I suggest you one thing that may solve your problem
Draw a not model line at on the geometry where you want to plot the field and then plot your field along that reference line in this way you can have three plots in x, y and z
 

I suggest you one thing that may solve your problem
Draw a not model line at on the geometry where you want to plot the field and then plot your field along that reference line in this way you can have three plots in x, y and z

polyine 1 is a non model line.
i've also tried to draw a non model structure, and i couldn't see it in the drop down list.


Please have a look I have drawn two non model lines on a simple rectangular waveguide and both of them are appearing with the create report


Please have a look I have drawn two non model lines on a simple rectangular waveguide and both of them are appearing with the create report

As i said, polyine 1 is a non model line and appears in the field report. this isn't the problem,
Reciving field on one line will not solve my issue which is to recive it over a surface.
 
Last edited:

Status
Not open for further replies.

Part and Inventory Search

Welcome to EDABoard.com

Sponsor

Back
Top