Continue to Site

Welcome to EDAboard.com

Welcome to our site! EDAboard.com is an international Electronics Discussion Forum focused on EDA software, circuits, schematics, books, theory, papers, asic, pld, 8051, DSP, Network, RF, Analog Design, PCB, Service Manuals... and a whole lot more! To participate you need to register. Registration is free. Click here to register now.

[SOLVED] Getting Loop Gain of Boost Converter with UC3843 controller using SIMetrix software

Status
Not open for further replies.

kanmaedexandzelbladex

Member level 1
Joined
Jul 20, 2013
Messages
35
Helped
1
Reputation
2
Reaction score
1
Trophy points
8
Location
Philippines
Activity points
479
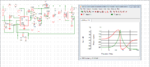
Hi everyone I am trying to measure the loop gain of my Boost Converter (Vin = 15V, Vout = 30V, up to 10A load) using the free version of the SIMetrix software, SIMetrix/SIMPLIS Intro 7.00. I am measuring the overall loop gain (outer voltage loop, including the current loop) in order to check the phase and gain plots for stability purposes. The controller used is the UC3843 controller also available in SIMetrix.

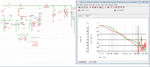
The problem is I can't believe that I am doing it right since the resulting plots are exactly the same regardless of whether I shut down the IC, change the compensation values drastically. The magnitude gain is very low ~ -50dB below at 1Hz up to 100kHz which is weird. It is weird since the resulting plots of output voltage curves are totally good and ok from no load up to 10A.

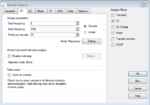
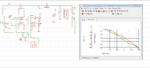
I used AC analysis. Attached here are images of the schematic, the options I chose in the Simulator->Choose Analysis window, and the plot which remains the same regardless of compensator values. The plots change when I change the load, but the magnitude gain is still very low.

Some explanations to the schematic: input voltage is V1 (displayed as 15V in schematic), load is I1 (displayed as 8A in the schematic), C4,R15,C5 are the compensators Type II compensator, Q2 and R10 comprise the slope compensator, I used 3 parallel NMOSFETS IRF32105 each having Rg = 10 ohms and Rgs = 30kohms. V3 is the perturbation, and the probe used is the Bode Plot Probe.
 

Attachments

  • Attempt1loopgain.PNG
    Attempt1loopgain.PNG
    50 KB · Views: 301
  • optionsforattempt1.PNG
    optionsforattempt1.PNG
    25.3 KB · Views: 170

You can't use AC analysis for switched mode controllers because their transfer function isn't time-continuous.

The you only transient analysis available and can determine the loop behaviour with sine or step stimulus.
 
Hey thanks for replying! I was reading some online literature and found out that your explanation seems to be the case (https://sites.google.com/site/frankwiedmann/loopgain). Step responses of my circuit showed very small (close to none) ringing for all loads. Also, inputting sinusoids showed that the power supply doesn't have much good ripple rejection. So the gain had to have some large size at low frequencies which makes my earlier results unreasonable. I found this website: **broken link removed** and it shows here that the loop gain could be measured with AC analysis, using the SIMPLIS simulator of SIMetrix/SIMPLIS Intro 7.00. I tried this and the results were more realistic. This gave me rise to some more questions:

1.) When I try to go into higher frequencies, let's say close to 500kHz above, the resulting gain and phase plots becomes zig-zag (unrealistic?). This not only happens in the simulator but it also happens when I try to use real network analyzers with real power supplies. Is this just normal or is there some physical/technical explanation to why this is? My switching frequency is 100kHz and I am using a fixed frequency pwm control.

2.) Do you know of any possibility how the simplis simulator could possibly have accomplished this?

Some explanations: Due to the few allowed nodes/components to simulate in the free version of the software (I'm using the free version), I reduced the circuit size by removing parallel FETs and parallel diode, but I'm still sure that they can take the currents and voltages.
 

Attachments

  • SuccessV1.PNG
    SuccessV1.PNG
    46.6 KB · Views: 179
  • SuccessV1Problem.PNG
    SuccessV1Problem.PNG
    55.7 KB · Views: 187
Last edited:

I think normally we are only interested in responses upto 1/2 of the switching frequency, beyond which we usually ignored.
Refer to your last Simplis simulation results, looks like your switching freq. is about 110KHz, manifested by a dip of the gain curve and a zig-zag of the phase curve at that frequency, (another dip at 220KHz, at not so obvious at other harmonics though).
May be you can just scan the high frequency portion and increase the number of data point per freq decade and see what happen.
 
Thanks for mentioning the SIMPLIS software. I wasn't aware of it (or may be forgot it again). It seems to achieve a very realistic AC simulation of time-discrete systems. The modulator creates true time delay (a rule of thumb says average deadtime is 1/2 of switching period), resulting in a continuously falling phase. In logarithmic scale, the phase curve is even exponential, as visible in the 500 kHz plot.

For fixed frequency pwm, the time-continuous equivalent circuit is rather simple, thus I have no doubts that SIMPLIS can model it's small signal behaviour correctly. A switched mode circuit can involve strong non-linearity, e.g. by changing between continuous and discontinuous conduction mode, so a parametric analysis for different operation points is basically suggested.

It would be interesting to know if SIMPLIS can handle less less linear modulators, e.g. a hysteretic controller.
 
Yeah. I saw on a some book (Pulse-Width Modulated Converters by Marian Kazimierczuk) that State-Space Averaged Models have the disadvantage that up to 1/2 of the switching frequency could be shown to be accurate because of a theoretical limitation regarding the mathematics. It also discusses the exponentials that occur in the modulator. I will read more of that I guess. Thanks for the replies guys.

The video on the SIMPLIS website shows a self-oscillating (variable frequency) flyback being run to get the loop gain/phase bode plots. I also tested it on my Fixed Off Time pwm control Boost and it also works up to 1/2 the switching frequency.
 

I won't say that the phase information above 1/2 or full switching frequency is wrong, it's just meaningless. If you don't manage to drop loop gain below unity before, the control loop will hardly be stable.
 
kanmaedexandzelbladex, the circuit you are simulating is a switched model, not SSA model.The former should be more accurate especially at high frequencies.
Accuracy of conventional SSA upto Nyquist frequency ,i.e. 1/2 of switching frequency, is questionable. It is topology dependent, some are better than others.
 
Thanks for the inputs! I learned a lot. I think I will read more of this to gain a deeper mathematical explanation for all this.
 

Status
Not open for further replies.

Part and Inventory Search

Welcome to EDABoard.com

Sponsor

Back
Top