Continue to Site

Welcome to EDAboard.com

Welcome to our site! EDAboard.com is an international Electronics Discussion Forum focused on EDA software, circuits, schematics, books, theory, papers, asic, pld, 8051, DSP, Network, RF, Analog Design, PCB, Service Manuals... and a whole lot more! To participate you need to register. Registration is free. Click here to register now.

LTspice IV Help- Cannot view waveform window

Status
Not open for further replies.

Neyolight

Full Member level 5
Joined
Aug 29, 2011
Messages
306
Helped
3
Reputation
6
Reaction score
3
Trophy points
1,298
Location
World
Activity points
3,624
Hi all

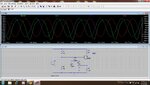
I cannot see the waveform output window during simulation in LTspice IV.

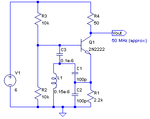
The waveform window worked fine this morning and then I went on to build the colpitts oscillator ( please see the attachment) and ever since I cannot see the waveform windows. The simulation runs though...

Any ideas?

Thanks
 

Attachments

  • NPN_Colpitts_oscillator_base_coil.png
    NPN_Colpitts_oscillator_base_coil.png
    5.7 KB · Views: 374

C3 causes a transient too long.

Don't Skip Initial Operating Point Solution (UIC), sometimes oscillation start too.
Or use C3 = 1nF for testing.
 
Thanks for that! With 1nF I do get the waveform window but the output is not a perfect sin wave - any idea why?

Its amazing how you can just look at the circuit and know whats wrong with it- wonder when would I be able to do that =P
 
Last edited:

Thanks for that! With 1nF I do get the waveform window but the output is not a perfect sin wave - any idea why?

Its a problem of this type of oscillators, the gain must be close to the limit of oscillation to minimize distortion.

To decrease the gain add a resistance to the emitter of 2N2222 (1 ... 1k) and increase it until near the limit of start the oscillation.
 
Thanks, I will try that now.

How do I measure frequency of the output sin wave? [In LTspice]
 

Thanks for that !

The following image includes the current circuit Im playing with....The Vout (green) is not a proper sin wave and Im not sure why!
 

Attachments

  • oscillator.jpg
    oscillator.jpg
    288.8 KB · Views: 211

A quick way to measure the frequency of a waveform from the plot is to measure the time difference between adjacent peaks. You can do this by pointing to the peak and left-clicking the mouse button -- and while keeping the left-mouse button pressed, drag the mouse to the next peak. You should see a dotted line forming a rectangle. If you look to the lower left corner of the ltspice window, you will see the vertical and horizontal differences being reported. You can also use this technique to make vertical measurements as well. It is not as accurate as using the actual cursors (or using .measure statements), but it is quite easy once you get a hang of it. Try it out and see if it does the job!

Best regards,
v_c
 
Thats what I ended up using today v_c ! :)
 

Status
Not open for further replies.

Similar threads

Part and Inventory Search

Welcome to EDABoard.com

Sponsor

Back
Top