electronical
Advanced Member level 4
hello every body.
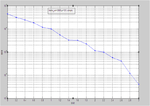
I wrote a plan for ldpc code an get these result but it is different the result that recieved from papaers.can any boby tell me why the result is different?
I wrote these code for n=1210 and frame_num=2000, code rate=0.5;
I used these code for channel
[m,n]=size(H);
sigma=sqrt(10^(-SNRindB1/10));
msg = randint(1,n-m);
c=rem(msg*G,2);
modObj = modem.pskmod('M',2,'InputType','Bit');
modulatedsig = modulate(modObj, c);
receivedsig = awgn(modulatedsig, SNRindB1(I), 0); ...
% Compute log-likelihood ratios (AWGN channel)
demodObj = modem.pskdemod(modObj,'DecisionType','LLR', ...
'NoiseVariance',sigma);
LLR = demodulate(demodObj, receivedsig);
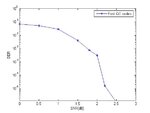
and I expect nearly these result(fast QC codes figure) :at low value SNR ,bit error rate value be about 10^(-1)
I wrote a plan for ldpc code an get these result but it is different the result that recieved from papaers.can any boby tell me why the result is different?
I wrote these code for n=1210 and frame_num=2000, code rate=0.5;
I used these code for channel
[m,n]=size(H);
sigma=sqrt(10^(-SNRindB1/10));
msg = randint(1,n-m);
c=rem(msg*G,2);
modObj = modem.pskmod('M',2,'InputType','Bit');
modulatedsig = modulate(modObj, c);
receivedsig = awgn(modulatedsig, SNRindB1(I), 0); ...
% Compute log-likelihood ratios (AWGN channel)
demodObj = modem.pskdemod(modObj,'DecisionType','LLR', ...
'NoiseVariance',sigma);
LLR = demodulate(demodObj, receivedsig);
and I expect nearly these result(fast QC codes figure) :at low value SNR ,bit error rate value be about 10^(-1)
Attachments
Last edited: