Continue to Site

Welcome to EDAboard.com

Welcome to our site! EDAboard.com is an international Electronics Discussion Forum focused on EDA software, circuits, schematics, books, theory, papers, asic, pld, 8051, DSP, Network, RF, Analog Design, PCB, Service Manuals... and a whole lot more! To participate you need to register. Registration is free. Click here to register now.

help in correcting error in following matlab code

Status
Not open for further replies.
check for this

bpskmod=b1.*w; % Modulated waveform
I think you need loop there also check w too
I think you need loop there too....

Good Luck
 

i have written following code for a plot of ber vs snr but nothing is been displayed on the graph except x-axis, y-axis n title of d graph.
clc;
close all;
no_of_bits=1000;
M=100;
no_of_samples=20;

threshold = 0.5;
snr=[-3:1:10];
Tb = 1; % Bit duration
signalVariance=1;
fc = 3/Tb; % Carrier frequency
t = linspace(0, 1, no_of_samples);
t1=linspace(0, 1, no_of_samples);
t2=t1/fc;
w=cos(2*pi*fc*t2);

for k=1:length(snr)
err(k)=0;
for m=1:M
A = rand(1,no_of_bits); % Generate a random sequence
for i=1:no_of_bits
if (A(i)>=threshold)
A(i)=1;
else
A(i)=0;
end
end
d = A(1:no_of_bits);% Binary sequence
b = 2*d-1; % Bipolar sequence
for i=1:no_of_bits
for j=1:no_of_samples
b1(j)=b(i);
end
bpskmod=b1.*w; % Modulated waveform
%Noise addition

noise = (10^(-snr(k)/20))*randn(1,no_of_samples);
received = bpskmod + noise;
% Multipying the received signal with carrier waveform
v = received.*w;
x=linspace(0, 1, no_of_samples);
y=v;
z=trapz(y);
if z<0
z=0;
else
z=1;
end
bpsk(i)=z;
bpskout(i)=bpsk(i);
if (d(i)~=bpskout(i))
err(k)=err(k)+1;
end
end
d;
bpskout;
err(k);
end
ber(k)=err(k)/(no_of_bits*M)
snr(k)
end
% plot
close all
figure
semilogy(snr(k),ber(k));
axis([-3 10 10^-5 0.5])
grid on
xlabel('snr');
ylabel('Bit Error Rate');
title('Bit error probability curve for BPSK modulation');
 

help plz. M getting error in following code...
clc;
close all;
clear all;
no_of_bits=1000;
M=100;
no_of_samples=20;
threshold = 0.5;
snr=[-9:1:3];
Tb = 1; % Bit duration
signalVariance=1;
fc = 3/Tb; % Carrier frequency
t = linspace(0, 1, no_of_samples);
t1=linspace(0, 1, no_of_samples);
t2=t1/fc;
inPhaseOsc = cos(2*pi*fc*t2);
quadPhaseOsc = sin(2*pi*fc*t2);
for i=1:10
ber(i)=0;
end
for k=1:length(snr)
sn(k)=snr(k)+6;
err(k)=0;
for m=1:M
A = rand(1,no_of_bits); % Generate a random sequence
for i=1:no_of_bits
if (A(i)>=threshold)
A(i)=1;
else
A(i)=0;
end
end
d = A(1:no_of_bits);% Binary sequence
b = 2*d-1; % Bipolar sequence
o = b(1:2:end); %separating odd bits
e = b(2:2:end); %separating even bits
for i=1:no_of_bits
for j=1:no_of_samples
o1(j)=o(i);
e1(j)=e(i);
end
qpskmod= o.*quadPhaseOsc + e.*inPhaseOsc; % Modulated waveform
%Noise addition

noise = (10^(-snr(k)/20))*randn(1,no_of_samples);
received = qpskmod + noise;
% Multipying the received signal with carrier waveform
v1 = received.*quadPhaseOsc;
x1=linspace(0, 1, no_of_samples);
y1=v1;
z1=trapz(y);
if z1<0
z1=0;
else
z1=1;
end
v2=received.*inPhaseOsc;
x2=linspace(0, 1, no_of_samples);
y2=v2;
z2=trapz(y);
if z2<0
z2=0;
else
z2=1;
end
qpsk(i)=z;
qpskout(i)=qpsk(i);
if (d(i)~=qpskout(i))
err(k)=err(k)+1;
end
end
d
qpskout
err(k);
end
ber(k)=err(k)/(no_of_bits*M)
sn(k)
end
% plot
close all
figure
semilogy(sn,ber);
axis([-3 14 10^-10 10^0]);
grid on;
xlabel('snr');
ylabel('Bit Error Rate');
title('Bit error probability curve for QPSK modulation');
 

can tell me what is problem that you are getting in the code....I think same problem of Graph is not getting displayed then you need to check for ber and SNR as per your logic .....

Good Luck
 

m not getting the graph of ber and snr for qpsk... kindly have a look at my code...
clc;
close all;
clear all;
no_of_bits=1000;
M=100;
no_of_samples=20;
threshold = 0.5;
snr=[-3:20];
Tb = 1; % Bit duration
fc = 3/Tb; % Carrier frequency
t = linspace(0, 1, no_of_samples);
t1=linspace(0, 1, no_of_samples);
t2=t1/fc;
inPhaseOsc = cos(2*pi*fc*t2);
quadPhaseOsc = sin(2*pi*fc*t2);
for i=1:10
ber(i)=0;
end
for k=1:length(snr)
sn(k)=snr(k)+6;
err(k)=0;
for m=1:M
A = rand(1,no_of_bits); % Generate a random sequence
for i=1:no_of_bits
if (A(i)>=threshold)
A(i)=1;
else
A(i)=0;
end
end
d = A(1:no_of_bits);% Binary sequence
b = 2*d-1; % Bipolar sequence
o = b(1:2:end); %separating odd bits
e = b(2:2:end); %separating even bits
for i=1:499
for j=1:no_of_samples
o1(j)=o(i);
e1(j)=e(i);
end
qpskmod= o1.*quadPhaseOsc + e1.*inPhaseOsc; % Modulated waveform
%Noise addition
noise = (10^(-snr(k)/20))*randn(1,no_of_samples);
received = qpskmod + noise;
% Multipying the received signal with carrier waveform
v1 = received.*quadPhaseOsc;
x1=linspace(0, 1, no_of_samples);
y1=v1;
z1=trapz(y1);
if z1<0
z1=0;
else
z1=1;
end
qpsk1(i)=z1;
v2 = received.*inPhaseOsc;
x2=linspace(0, 1, no_of_samples);
y2=v2;
z2=trapz(y1);
if z2<0
z2=0;
else
z2=1;
end
qpsk2(i)=z2;
qpskout(i)=qpsk1(i)+qpsk2(i);
if (d(i)~=qpskout(i))
err(k)=err(k)+1;
end
end
d;
qpskout;
err(k);
end
ber(k)=err(k)/(no_of_bits*M)
sn(k)
end
% plot
close all
figure
semilogy(sn,ber);
axis([-3 15 10^-5 10^0]);
grid on;
xlabel('snr');
ylabel('Bit Error Rate');
title('Bit error probability curve for QPSK modulation');
 

Hi Shruti01....

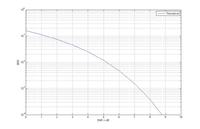
I got matlab output as jpg image attached ....

Let me know is it right or wrong....

Good Luck matlab_graph.jpg
 

M getting error in following code for qpsk. Kindly have a luk @ d code.
clc;
close all;
clear all;
no_of_bits=1000;
M=100;
no_of_samples=20;
threshold = 0.5;
snr=[-3:20];
Tb = 1; % Bit duration
fc = 3/Tb; % Carrier frequency
t = linspace(0, 1, no_of_samples);
t1=linspace(0, 1, no_of_samples);
t2=t1/fc;
inPhaseOsc = cos(2*pi*fc*t2);
quadPhaseOsc = sin(2*pi*fc*t2);
for i=1:10
ber(i)=0;
end
for k=1:length(snr)
sn(k)=snr(k)+6;
err(k)=0;
for m=1:M
A = rand(1,no_of_bits); % Generate a random sequence
for i=1:no_of_bits
if (A(i)>=threshold)
A(i)=1;
else
A(i)=0;
end
end
d = A(1:no_of_bits);% Binary sequence
b = 2*d-1; % Bipolar sequence
o = b(1:2:end); %separating odd bits
e = b(2:2:end); %separating even bits
for i=1:499
for j=1:no_of_samples
o1(j)=o(i);
e1(j)=e(i);
end
qpskmod= o1.*quadPhaseOsc + e1.*inPhaseOsc; % Modulated waveform
%Noise addition
noise = (10^(-snr(k)/20))*randn(1,no_of_samples);
received = qpskmod + noise;
% Multipying the received signal with carrier waveform
v1 = received.*quadPhaseOsc;
x1=linspace(0, 1, no_of_samples);
y1=v1;
z1=trapz(y1);
if z1<0
z1=0;
else
z1=1;
end
qpsk1(i)=z1;
v2 = received.*inPhaseOsc;
x2=linspace(0, 1, no_of_samples);
y2=v2;
z2=trapz(y1);
if z2<0
z2=0;
else
z2=1;
end
qpsk2(i)=z2;
qpskout(i)=qpsk1(i)+qpsk2(i);
if (d(i)~=qpskout(i))
err(k)=err(k)+1;
end
end
d;
qpskout;
err(k);
end
ber(k)=err(k)/(no_of_bits*M)
sn(k)
end
% plot
close all
figure
semilogy(sn,ber);
axis([-3 15 10^-5 10^0]);
grid on;
xlabel('snr');
ylabel('Bit Error Rate');
title('Bit error probability curve for QPSK modulation');

---------- Post added at 16:46 ---------- Previous post was at 16:43 ----------

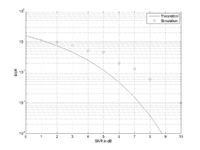
d graph's wrong. As snr value increases, ber shld decreases.... kindly have a luk @ my code....
 

Normally BER vs SNR (dB)


Simulation results will be slightly different


I have written following code for offset QPSK in matlab. I am plotting ber vs snr curve but i am not getting the required curve. what i am getting i have attached the figure. The curve shld be exponentially decreasing as snr increases. Kindly help. Following is my code.
clc;
close all;
clear all;
no_of_bits=1000;
M=100;
no_of_samples=20;
threshold = 0.5;
snr=[-3:20];
Tb = 1; % Bit duration
fc = 3/Tb; % Carrier frequency
t = linspace(0, 1, no_of_samples);
t1=linspace(0, 1, no_of_samples);
t2=t1/fc;
inPhaseOsc = cos(2*pi*fc*t2*5);
quadPhaseOsc = sin(2*pi*fc*t2*5);
for l=1:10
ber(l)=0;
end
for k=1:length(snr)
sn(k)=snr(k)+6;
err(k)=0;
for m=1:M
A = rand(1,no_of_bits); % Generate a random sequence
for l=1:no_of_bits
if (A(l)>=threshold)
A(l)=1;
else
A(l)=0;
end
end
d = A(1:no_of_bits);% Binary sequence
b = 2*d-1; % Bipolar sequence
o = b(1:2:end); %separating odd bits
e = b(2:2:end); %separating even bits
ew = e(1:end-1); % Delay of 1 bit in even bits
ee = padarray(ew,[0,1],'pre'); % add zeros before the array
for l=1:500
for j=1:no_of_samples
o1(j)=o(l);
ee1(j)=ee(l);
end
offqpskmod= ee1.*inPhaseOsc+o1.*quadPhaseOsc; % Modulated waveform
%Noise addition
noise = (10^(-snr(k)/20))*randn(1,no_of_samples);
received = offqpskmod + noise;
% Multipying the received signal with carrier waveform
v1 = received.*quadPhaseOsc;
y1=v1;
z1=trapz(y1);
if (z1<0)
z1=0;
else
z1=1;
end
offqpskout(2*(l-1)+1)=z1;
v2 = received.*inPhaseOsc;
y2=v2;
z2=trapz(y2);
if (z2<0)
z2=0;
else
z2=1;
end
zw = z2(1:end-1); % Delay of 1 bit
zz = padarray(zw,[0,1],'pre'); % add zeros before the array
offqpskout(2*(l-1)+2)=zz;
end
for n=1:no_of_bits
if (d(n)~=offqpskout(n))
err(k)=err(k)+1;
end
end
d;
offqpskout;
err(k);
end
ber(k)=err(k)/(no_of_bits*M)
sn(k)
end
% plot
close all
figure
semilogy(sn,ber);
axis([3 26 10^-10 10^0]);
grid on;
xlabel('snr');
ylabel('Bit Error Rate');
title('Bit error probability curve for OffsetQPSK modulation');
Ber curve for offset QPSK.JPG
 

Status
Not open for further replies.

Similar threads

Part and Inventory Search

Welcome to EDABoard.com

Sponsor

Back
Top