maninnet
Member level 5
op amp bode plots
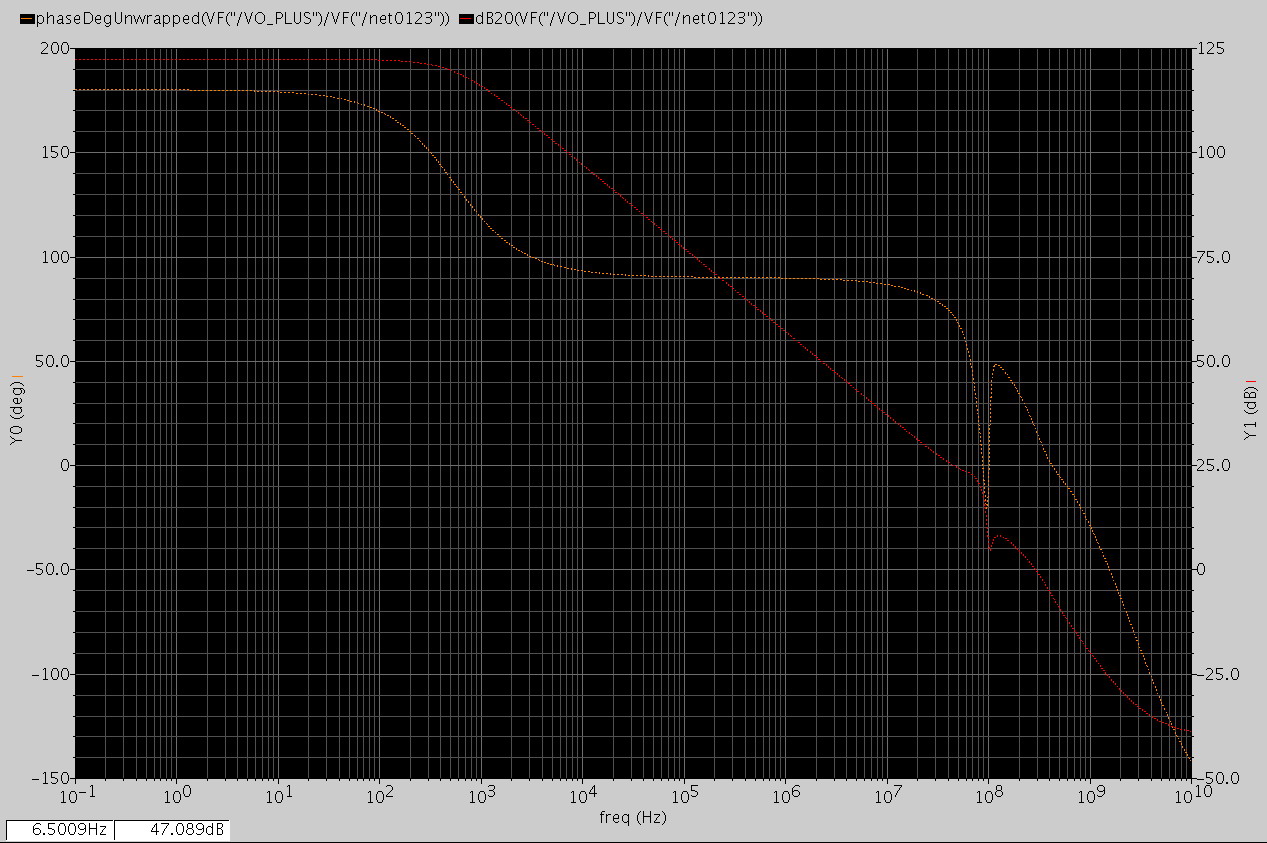
the AC repsonse (open loop) of an telescopic fully differential OTA is shown in the pictuere, the OTA has gain boost stages (implemented by folded cocode topology)on both the PMOS and NMOS stacks.
1. I don't know how to intepret the notch of the phase at around f=1e8 MHz (note that simulator shifts the phase up by 180 degree, so the phase margin iis < 0 at the frequency).
2. There is also a small notch of the gain at at around f=1e8 MHz, if there is a pole kick in around that frequency, the gain rolloff would not be 20dB/decade after that frequency.
3. How can I solve these problems
hope someone can explain .