Sharath1160
Newbie level 6
Hi all,
I am working in Image and audio processing.
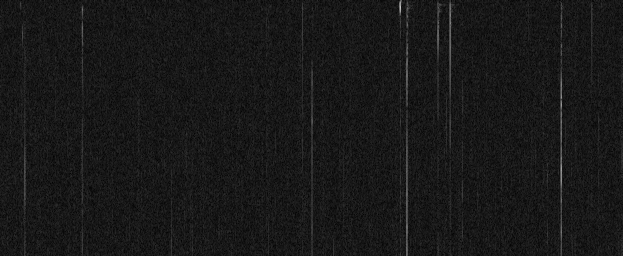
I read the audio file (WAV) that is of 20 min and divided the original audio file into 10 second ‘chunks’ of 120 files. Then I computed a spectrogram for each chunk, and obtained 120 spectrograms and made it into a bmp file. I used wiener filter and reduced the noise and got the new spectrograms.
The project is about the bird acoustics. So there is rain in the audio that i had been given and could clearly show it in each chunks of the spectrogram.
I just want to show the rain ( the vertical lines) by some colur. ( red) . I want to count the vertical lines by showing it in some distinctive red colour over the spectrogram. So that even the minute vertical line is represented and I am able to count the rainfall.
Can someone please provide me the code to do it.:-?
It is very urgent .
It would be of great help.
P.s: This is my first post. So i am not able to post links till i m done with 2 posts.. So pls chk below for the image.
Thanks in advance,
Sharath
---------- Post added at 23:29 ---------- Previous post was at 23:28 ----------
Bounce....
---------- Post added at 23:31 ---------- Previous post was at 23:29 ----------
Still I am not able to post the link
---------- Post added at 23:53 ---------- Previous post was at 23:31 ----------
This is the image displaying the rainfall in the spectrogram and I want to show even the minute lines using a red color. So that I would be counting the no of instances , i mean the vertical lines to get the rainfall data.
Thanks in advance,
Sharath
I am working in Image and audio processing.
I read the audio file (WAV) that is of 20 min and divided the original audio file into 10 second ‘chunks’ of 120 files. Then I computed a spectrogram for each chunk, and obtained 120 spectrograms and made it into a bmp file. I used wiener filter and reduced the noise and got the new spectrograms.
The project is about the bird acoustics. So there is rain in the audio that i had been given and could clearly show it in each chunks of the spectrogram.
I just want to show the rain ( the vertical lines) by some colur. ( red) . I want to count the vertical lines by showing it in some distinctive red colour over the spectrogram. So that even the minute vertical line is represented and I am able to count the rainfall.
Can someone please provide me the code to do it.:-?
It is very urgent .
It would be of great help.
P.s: This is my first post. So i am not able to post links till i m done with 2 posts.. So pls chk below for the image.
Thanks in advance,
Sharath
---------- Post added at 23:29 ---------- Previous post was at 23:28 ----------
Bounce....
---------- Post added at 23:31 ---------- Previous post was at 23:29 ----------
Still I am not able to post the link
---------- Post added at 23:53 ---------- Previous post was at 23:31 ----------
This is the image displaying the rainfall in the spectrogram and I want to show even the minute lines using a red color. So that I would be counting the no of instances , i mean the vertical lines to get the rainfall data.
Thanks in advance,
Sharath