Continue to Site

Welcome to EDAboard.com

Welcome to our site! EDAboard.com is an international Electronics Discussion Forum focused on EDA software, circuits, schematics, books, theory, papers, asic, pld, 8051, DSP, Network, RF, Analog Design, PCB, Service Manuals... and a whole lot more! To participate you need to register. Registration is free. Click here to register now.

Experts of Lecroy scope, FFT, and MATLAB... pls assist!

Status
Not open for further replies.

powersys

Advanced Member level 1
Joined
Nov 29, 2005
Messages
439
Helped
3
Reputation
6
Reaction score
2
Trophy points
1,298
Activity points
4,981
lecroy scope

Hello,

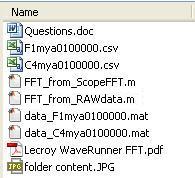
We've a Lecroy Waverunner 204Xi. Recently, I performed the FFT (using scope FFT function) of a measured signal. However, I found out, when I calculated the FFT of the measured signal in MATLAB, the results are different from that obtained from the scope. I'm quite sure the algorithm used in my MATLAB code is correct because I have copied it from MATLAB help file, and it has been validated using a simple sinewave example. Probably the way the scope calculates the FFT is different. I've a few questions documented in a PDF file. Besides, the raw data (recorded by the scope) as well as m-files to do all the calculations, are provided in 'Lecroy.zip'.

Kindly advise.

Thank you very much

69_1229951899.jpg
 

fft matlab

I can't say for sure that I know what problem you are having because I have not seen your data, but there are some things that come to mind. First off, some FFT algorithms divide by the number of points and some do not. MATLAB does not so if your scope is given you smaller numbers, try dividing your FFT data by the number of points in the FFT. Second, you spectrum may be shifted. Try the MATLAB command fftshift after you fft command. Your statement would look like

G = fftshift(fft(g))/length(g);

Third, your scope may be giving you a power spectral density. This is computed from G above as

PSD = abs(G).^2;

Hope this helps!
-Tip
 

    powersys

    Points: 2
    Helpful Answer Positive Rating
spectrum scope fft in matlab

Thanks for your reply. Yes, the scope gives the PSD of the FFT. I've compiled some results in the attachment plus some m-files. I really hope that you can help to look into my problem. In fact, it's not easy to find someone like who knows the FFT function in both scope and MATLAB. I wrote to Lecroy and their engineers kept on delaying their response.

Merry Christmas and Happy New Year

Thanks.


rrumpf said:
I can't say for sure that I know what problem you are having because I have not seen your data, but there are some things that come to mind. First off, some FFT algorithms divide by the number of points and some do not. MATLAB does not so if your scope is given you smaller numbers, try dividing your FFT data by the number of points in the FFT. Second, you spectrum may be shifted. Try the MATLAB command fftshift after you fft command. Your statement would look like

G = fftshift(fft(g))/length(g);

Third, your scope may be giving you a power spectral density. This is computed from G above as

PSD = abs(G).^2;

Hope this helps!
-Tip
 

code assist matlab

Some problems of your calculations are obvious.
Code:
plot(f,2*abs(signal_dB(1:NFFT/2+1)))
This results in an inverted plot as shown in Fig. 3a, cause signal_db is negative. I don't understand what you try to achieve here. I also don't see the purpose of the factor 2. If you invert the plot and remove the extra gain, it fit's much better the oscilloscope FFT display.

Generally, I suggest to validate the FFT operation with simple periodical signals rather than empirical signals that are similar to coloured noise. A squarewave e.g. has a well-known fourier series and the spectral results can be easily checked.
 

    powersys

    Points: 2
    Helpful Answer Positive Rating
fft + matlab

Thanks for reply. In fact, I copied (and slightly modified) the code from MATLAB Help (https://www.mathworks.com/access/he...ml?/access/helpdesk/help/techdoc/ref/fft.html).

Code:
NFFT = 2^nextpow2(L); % Next power of 2 from length of y
Y = fft(y,NFFT)/L;
f = Fs/2*linspace(0,1,NFFT/2+1);

% Plot [b]single-sided[/b] amplitude spectrum.
plot(f,2*abs(Y(1:NFFT/2+1))) 
title('Single-Sided Amplitude Spectrum of y(t)')
xlabel('Frequency (Hz)')
ylabel('|Y(f)|')

If I'm not wrong, the factor '2' is required for 'single-sided' spectrum plot. However, I'm not sure why 'abs' is used in the code.

By the way, I will capture a sinewave using the scope. Then, I will compile some results and discuss with you.

Kindly advise.


FvM said:
Some problems of your calculations are obvious.
Code:
plot(f,2*abs(signal_dB(1:NFFT/2+1)))
This results in an inverted plot as shown in Fig. 3a, cause signal_db is negative. I don't understand what you try to achieve here. I also don't see the purpose of the factor 2. If you invert the plot and remove the extra gain, it fit's much better the oscilloscope FFT display.

Generally, I suggest to validate the FFT operation with simple periodical signals rather than empirical signals that are similar to coloured noise. A squarewave e.g. has a well-known fourier series and the spectral results can be easily checked.
Code:
 

fft in matlab

I complained about an inappropriate abs() applied to signal_dB. I don't see this in the MATLAB help code. Also a factor 2 applied to linear magnitude has obviously a different meaning in logarithmic representation, it converts to an offset, correctly.
 

    powersys

    Points: 2
    Helpful Answer Positive Rating
spectral in logarithmic representation in matlab

FvM said:
I complained about an inappropriate abs() applied to signal_dB. I don't see this in the MATLAB help code. Also a factor 2 applied to linear magnitude has obviously a different meaning in logarithmic representation, it converts to an offset, correctly.

Thanks for your reply.

For the sake of convenience, Fig. 1 shows the methodology of FFT calculation employed in the Lecroy (extracted from Lecroy WaveRunner 204Xi Operator's Manual). For your information, the scope was configured to give the 'Power Spectrum' of the FFT results as shown in Fig. 2a.

I've modified the MATLAB code, i.e. removed the '2' factor, as well as the 'abs', to be plot(f,signal_dB(1:NFFT/2+1)).
Obviously, if we compare Fig. 2a and Fig. 3a, both show the similar trend. However, the plot in Fig. 2a is around -40dB, whilst the plot in Fig. 3a is around -60dB, i.e. both differ by 20dB. Do you have any idea where does this 20dB come from?

The next question:
The plots of frequency spectrum (in magnitude), i.e. Fig. 2b and Fig. 3b, are still very much different in 'magnitude'. Do you have any suggestion?

Kindly advise.


Fig. 1. FFT calculation (extracted from Lecroy WaveRunner 204Xi Operator's Manual)
32_1230748365.jpg


Some results after code modification
85_1230749497.jpg
 

fft 2*abs

Anyone could help?
Thanks.
 

Status
Not open for further replies.

Part and Inventory Search

Welcome to EDABoard.com

Sponsor

Back
Top