david87
Junior Member level 1
Hi,
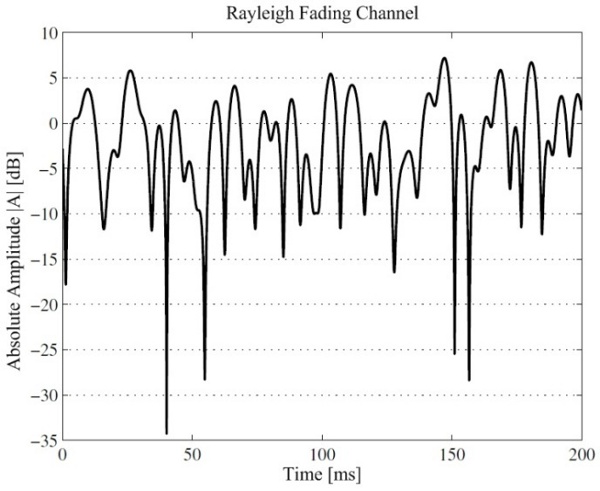
I'm using R&S FSU spectrum analyzer, I want to get a proper received Envelope and from that i need to calculate the fading statistics. But while taking the measurements i'm getting the image which i have attached with this post.
I'm transmitting a sine wave from signal generator(freq:2.4GHz, level: 0dbm) and receiving it with spectrum analyzer(SA). I kept the SA in zero span mode for time domain measurements. Can anyone please see the image which i have attached and suggest me why i'm getting like this?
Regards,
David scevan