Continue to Site

Welcome to EDAboard.com

Welcome to our site! EDAboard.com is an international Electronics Discussion Forum focused on EDA software, circuits, schematics, books, theory, papers, asic, pld, 8051, DSP, Network, RF, Analog Design, PCB, Service Manuals... and a whole lot more! To participate you need to register. Registration is free. Click here to register now.

Simple kT/C Noise simulation in Cadence - V/sqrt(hz) instead of V^2/Hz

Status
Not open for further replies.

pifouille

Junior Member level 1
Joined
Apr 4, 2012
Messages
17
Helped
0
Reputation
0
Reaction score
0
Trophy points
1,281
Activity points
1,486
Hi everybody,

I'm learning how to perform noise simulation in Cadence/Spectre.
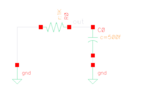
I've designed an simple RC network (R=1k, C=1p) and then performed a noise simulation between
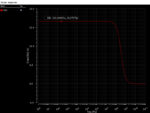
1 and 100GHz and set as the output the voltage around C.

I would expect the famous shaped DSP with 4kTR (16.5e-18 V^2/Hz @300K) at low frequency.
And spectre actually shows this almost exact value (I guess it uses 27ºC instead of 300K)
but my confusion is that it gives this value in V/sqrt(Hz)...

Shouldn't it be sqrt(16.5e-18) instead of 16.5e-18??

thanks!
 

What you are expecting is power while simulator can give you amplitude as well. Both are available in results.
 

Thanks a lot for your answer, even if I didn't really get it :)

I'm doing a very simple noise analysis on the circuit attached (rc_noise.png).
I set output noise as voltage between out and gnd and runned the simulation.
Going thru Direct Plot -> Main form, I can choose either V^2/Hz or V/√Hz
in this case, I got the result I expect: 16.5e-18 V^2/Hz or 4 nV/√Hz depending on my choice.

However, if instead of using Direct Plot -> Main form, I symply plot the out voltage (selecting plot from schematics),
I get the graph shown in rc_noise_dsp.png which shows in 16.5e-18 V/√Hz.
This is the result I would expect in V^2/Hz.

I understand it might not make a lot of sense to plot an output voltage in a noise simulation,
I just don't clearly see why...
As I said, I'm trying to understand..

Thanks again anyway for helping.
--- Updated ---

I actually thinks it some kind of bug cause it's clearly plotting VN2().. it should show V^2/Hz on the y-axis..
If I define my simulation outputs as 2 expressions VN() and VN2(), again, I get the right results with the right dimensions.
anyway. I was just curious.
 

Attachments

  • rc_noise.png
    rc_noise.png
    4.5 KB · Views: 200
  • rc_noise_dsp.png
    rc_noise_dsp.png
    35.4 KB · Views: 182
Last edited:

Status
Not open for further replies.

Part and Inventory Search

Welcome to EDABoard.com

Sponsor

Back
Top