Continue to Site

Welcome to EDAboard.com

Welcome to our site! EDAboard.com is an international Electronics Discussion Forum focused on EDA software, circuits, schematics, books, theory, papers, asic, pld, 8051, DSP, Network, RF, Analog Design, PCB, Service Manuals... and a whole lot more! To participate you need to register. Registration is free. Click here to register now.

Frequency spectrum in ADS

Status
Not open for further replies.

prafuldeo

Full Member level 3
Joined
Mar 26, 2008
Messages
173
Helped
38
Reputation
76
Reaction score
25
Trophy points
1,308
Location
UK
Activity points
2,318
Hello friends,

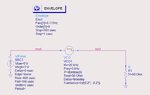
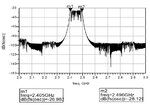
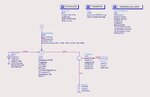
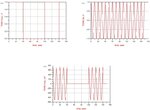
I have started to work on RF System design on ADS and I am new to it. I have designed a simple VCO (Fig.1) and can get the output signal in time domain (time vs voltage, Fig.2). I am however, cannot get the correct spectrum on frequency domain (dB vs frequency, Fig.3). How can I get it?

Many thanks
 

Attachments

  • Fig.1-vco circuit.jpg
    Fig.1-vco circuit.jpg
    49.5 KB · Views: 308
  • Fig. 2-vco output.jpg
    Fig. 2-vco output.jpg
    52.3 KB · Views: 278
  • Fig.3-desired output.jpg
    Fig.3-desired output.jpg
    97.7 KB · Views: 320

For example, run a harmonic balance simulation, or as starting point: convert your time domain signal into the frequency domain: fs(real(vout[0])) or db(fs(real(vout[0])))
 

For example, run a harmonic balance simulation, or as starting point: convert your time domain signal into the frequency domain: fs(real(vout[0])) or db(fs(real(vout[0])))

Sorry it may sound dumb but how can I do it? In equation editor?

How can I see this in HB simulation? I did run HB simulation but cant get the spectrum.

Thanks
 

Yes, the conversion from time to frequency domain can be realized in the dataset window, e.g in your second picture above just change real(vout[0]) to fs(real(vout[0])).
If you ran HB sim correctly, you should be able to plot voltages in the dataset window as function of frequency.
 

Yes, the conversion from time to frequency domain can be realized in the dataset window, e.g in your second picture above just change real(vout[0]) to fs(real(vout[0])).
If you ran HB sim correctly, you should be able to plot voltages in the dataset window as function of frequency.

Many thanks !

I tried the same method for this other circuit (see figures) but not able to get the frequency spectrum results. Could you comment on it?

Thanks
 

Attachments

  • Fig.1-circuit.jpg
    Fig.1-circuit.jpg
    53.4 KB · Views: 289
  • Fig. 2-output.jpg
    Fig. 2-output.jpg
    77.2 KB · Views: 349

Just don't plot TRAN... signals, use HB... signals from the dataset.
 

You can use fs() function in data display.More info is found in help..
HB may not work in that case because steady-state regime is not established due to ON/OFF signals.
 

Status
Not open for further replies.

Part and Inventory Search

Welcome to EDABoard.com

Sponsor

Back
Top