Ramakrishna_444
Member level 2
Hey All,
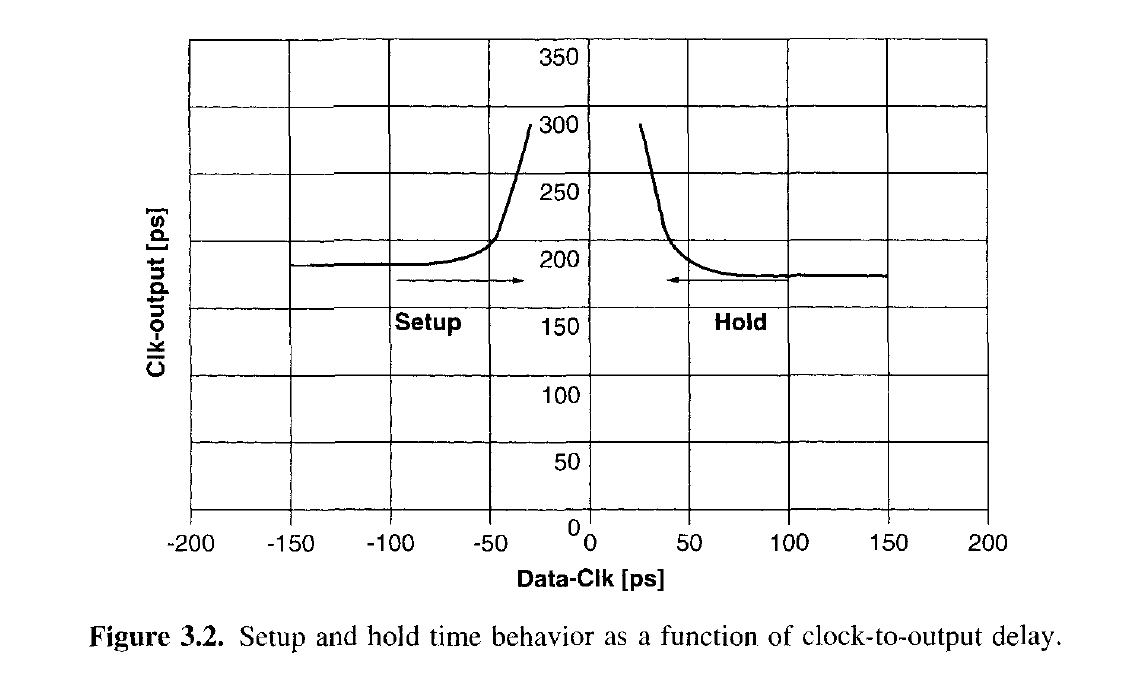
How to plot the sampling window of the Flipflop..?
Is this graph mirror image about y-axis for Setup & Hold Time..? (Please follow the attachment)
What do I need to understand by the Positive & Negative Data to Clk Offset in the Graph...?
Follow the attachments for my concern......
Thanks in advance.......