Continue to Site
Follow along with the video below to see how to install our site as a web app on your home screen.
Note: This feature may not be available in some browsers.
No
Both have 60 dB SNR at full bandwidth, but HP can improve sensitivity with Resolution bandwidth by adding points to go from 1MHz to 0.3Hz , whereas homebrew is fixed by SAW filter and has noise floor -75dB or -45dBm
Noise floor to overload point can be an especially big problem, and its not just the amplifiers.
Your filters and mixers may also start to go non linear and create intermodulation products where very strong signals are involved.
While you can very easily compress the whole thing with a log amplifier to display 90 db on the screen, your analog front end may fall well short of that.
Modern state of the art HF communications receivers struggle to reach that kind of dynamic range, its not that easy to do.
The general rule is to keep the signals at the lowest level possible to avoid overload.
Don't you think the absence of an input amplifier helps a lot on this? Although it lowers the sensitivity.
It really needs to be fired up on the bench with high amplitude dual equal level signal sources, and a big switched attenuator, and watch for IMD products to appear that you know should not be there, and see where it falls on its face.
Yes that is it.
Dynamic range is between the noise floor and the highest amplitude signal that creates no visible intermodulation products above the noise floor.
All you should see will be your two input carrier frequencies and nothing else.
Any distortion or non linearity anywhere in the system will generate new frequencies.
As long as these cannot poke their heads significantly above the noise floor your spectrum analyser will display only what it should display.
Dynamic range is then the difference between the noise floor and the maximum undistorted amplitude it can display.
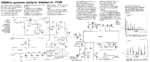
On the graph shown at your link, the noise floor is given as -126dbm.
Third order products start to appear above the noise floor as the input signal rises above -39dbm.
So the dynamic range in that case would be:
126dbm - 39dbm or 89db.