Continue to Site

Welcome to EDAboard.com

Welcome to our site! EDAboard.com is an international Electronics Discussion Forum focused on EDA software, circuits, schematics, books, theory, papers, asic, pld, 8051, DSP, Network, RF, Analog Design, PCB, Service Manuals... and a whole lot more! To participate you need to register. Registration is free. Click here to register now.

How to calculate THD for the following waveform

Status
Not open for further replies.

biswaIITH

Full Member level 4
Joined
Aug 23, 2014
Messages
204
Helped
27
Reputation
54
Reaction score
28
Trophy points
1,308
Location
Hyderabad
Activity points
2,907
clear image.JPG
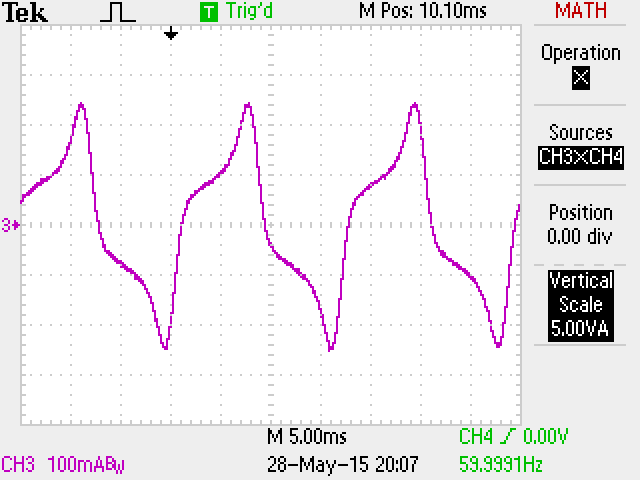
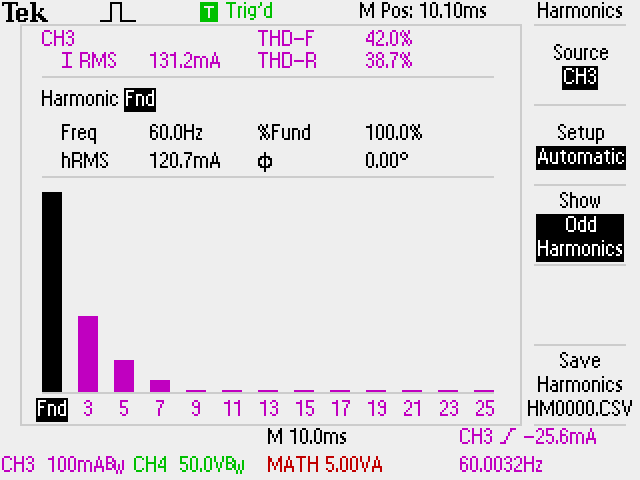
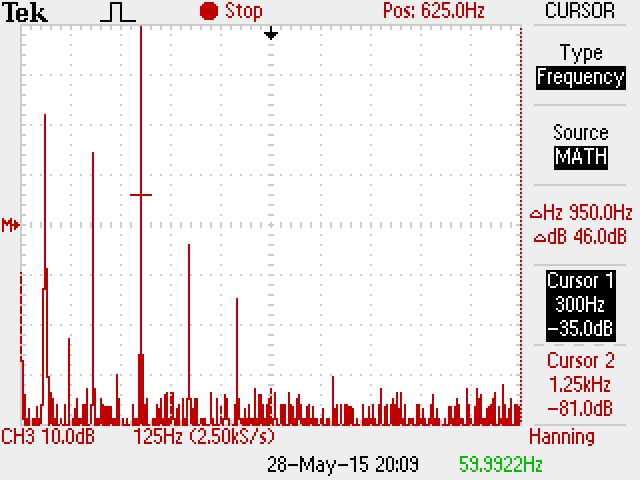
Hello friends...i got the below attached line voltage(upper one) and line current(lower one waveform from oscilloscope...This is the input waveforms of a lab designed PFC converter...But i am at a loss to calculate the THD(total harmonic distortion ) of the line current(Lower one)
 

Any signal has 3 components;
Signal Power
Noise Power
Distortion Power
One needs to filter out or measure the spectrum of the fundamental.

Looking at your waveform, there is a lot high frequency repeating glitches (i.e. synchronous noise thus harmonic and some which appear random .

A spectrum analyzer is the best tool to measure.
Another method is a recursive notch filter to remove fundamental and harmonics and leave random noise.

Lookup SINAD measurements which compare total signal ratio to that with fundamental removed, so becomes (s+n+d)/(n+d) in power levels.
 
  • Like
Reactions: biswaIITH

    biswaIITH

    Points: 2
    Helpful Answer Positive Rating
    V

    Points: 2
    Helpful Answer Positive Rating
Any signal has 3 components;
Signal Power
Noise Power
Distortion Power
One needs to filter out or measure the spectrum of the fundamental.

Looking at your waveform, there is a lot high frequency repeating glitches (i.e. synchronous noise thus harmonic and some which appear random .

A spectrum analyzer is the best tool to measure.
Another method is a recursive notch filter to remove fundamental and harmonics and leave random noise.

Lookup SINAD measurements which compare total signal ratio to that with fundamental removed, so becomes (s+n+d)/(n+d) in power levels.

i dont have access to spectrum analyser...where can i design that recursive notch filter???/is there any software tool to design the same??is there any software tool where we can measure THD of a particular waveform directly???
 
Last edited:

I presume you already reviewed the definition of THD. At first sight, the shown current waveform has much more non-harmonic noise, e.g. PWM carrier residuals than harmonic distortion. THD is probably below a few percent. In other words, it looks like a good working PFC with insufficient filter for PWM frequency.

You are asking how to calculate THD but you actually need to measure something before calculating THD. That's primarly a question of available instruments rather than software tools. Did you check the math features of your oscilloscope? Does it provide FFT? Waveform export?

Notch filter is a classical method to measure THD, but in the present case it would measure THD+noise instead of THD.
 

    V

    Points: 2
    Helpful Answer Positive Rating
I presume you already reviewed the definition of THD. At first sight, the shown current waveform has much more non-harmonic noise, e.g. PWM carrier residuals than harmonic distortion. THD is probably below a few percent. In other words, it looks like a good working PFC with insufficient filter for PWM frequency.

You are asking how to calculate THD but you actually need to measure something before calculating THD. That's primarly a question of available instruments rather than software tools. Did you check the math features of your oscilloscope? Does it provide FFT? Waveform export?

Notch filter is a classical method to measure THD, but in the present case it would measure THD+noise instead of THD.
yes it does provide FFT...The above current waveform is a cleaned waveform..i am attaching the original waveform that i got from oscilloscope..F0002TEK.JPG....measuring THD of this waveform is not going to give true measure...i have exported the data of the actual waveform from cro(attached in this post) into an excel sheet ..But that data also contains the unnecessary noise and spikes....

i am thinking if i can export data of the cleaned waveform(in the first post) to an excel sheet somehow, will i be able to measure THD in matlab???
 

    V

    Points: 2
    Helpful Answer Positive Rating
The best way to determine THD (without carrier frequency residuals and other noise) is to perform a FT and sum the power of e.g. 2nd to 40th harmonic. This can be done in Matlab, or even in MS Excel. You preferably perform the FT over full periods of the fundamental, e.g. 4 to 30 (see IEC 1000-3-2).
 
Is this a university project?

What model oscilloscope are you using? Is it a Tektronix TPS series scope, such as a TPS2024, or similar, with isolated inputs?

If it is a TPS oscilloscope, there exists a plug-in application that does power analysis, including calculating THD.
 

No i am using Tektronix TDS2012 oscilloscope..can we do power analysis ??
 

    V

    Points: 2
    Helpful Answer Positive Rating
Even Audacity using the AUX in audio port can measure the spectrum of 1V signal and THD.. ( Free Windows program. )

Then you can export to Excel or Matlab

FT.jpg
 

No i am using Tektronix TDS2012 oscilloscope..can we do power analysis ??

I don't see the same sort of power analysis that the TPS series has. Click on "Software packages" and you'll see the TPS2PWR1 software:

https://www.tek.com/oscilloscope/tps2000

Here's more detail on the package:

https://www.tek.com/datasheet/tps2pwr1

Your scope image suggests that you are measuring the grid voltage. How do you do this safely with a TDS2012 scope? The TPS series scopes have isolated inputs which makes this easy to do safely, but what do you do?

If you use the FFT display on your very noisy (un-cleaned) waveform, what does it look like? Adjust the horizontal time to get a good result. Post an image for us to look at.
 

    V

    Points: 2
    Helpful Answer Positive Rating
i am using an isolation transformer between the grid and the converter n doin all the measurements after the isolation transformer...
 

I think you might be able to use the FFT function of the scope. Here's a captured waveform of the magnetizing current of a large inverter transformer energized by the grid:

6349334100_1432872932.png


Here's what the TPS2PWR1 power analysis software shows for this waveform:

5167992800_1432873053.png


Notice the measured THD-R of 38.7%.

Here's the FFT of the same waveform. The horizontal speed was set to 100 milliseconds/div:

9594585600_1432873235.png


The only significant harmonics are the 3rd, 5th, 7th and 9th. Calculating the THD-R from the magnitudes of the fundamental and harmonics, which are -19.0dB, -26.6dB, -35.4dB, -44.2dB and -56.6dB, I get a value of 40.8%

You should capture a FFT display of your waveform. Adjust the horizontal time to get the best resolution, and post it here.
 
  • Like
Reactions: biswaIITH

    biswaIITH

    Points: 2
    Helpful Answer Positive Rating
    V

    Points: 2
    Helpful Answer Positive Rating
I think you might be able to use the FFT function of the scope.
Yes, but the post #1 /post #5 current waveforms have (guessed) not more than 1 or 2 % THD. Exact measurement with built-in FFT may be difficult (and a purely academic job, because PFC operation is obviously perfect).
 

Yes, but the post #1 /post #5 current waveforms have (guessed) not more than 1 or 2 % THD. Exact measurement with built-in FFT may be difficult (and a purely academic job, because PFC operation is obviously perfect).

That's why I said that he "might" be able to use the FFT function. I have no illusion that "exact" measurement is possible this way; even my measurement with a relatively clean waveform didn't give perfect agreement between the result from the power analysis software and the FFT method. Furthermore, I also said that he should post an image so we can help him determine if the result is useable.
 

Following is the FFT waveform F0009TEK.JPG..What conclusions can we draw frm here??
 

Attachments

  • F0008TEK.JPG
    F0008TEK.JPG
    140.8 KB · Views: 140
Last edited:

    V

    Points: 2
    Helpful Answer Positive Rating
Turn on the cursor function of the scope, select "frequency" as the type. Move the cursor over each significant spike in the FFT and note the frequency and level in dB. Post your measurements.
 

actually,while saving the waveform ,i saved all the data in an excelsheet...following are the values i got
fundamental(50)= -12.2dB
3rd harmonic(150)=-32.6dB
5th harmonic(250)=-45.4dB
7th harmonic(350)=-38.9dB
9th harmonic(450)=-39.4dB
 

actually,while saving the waveform ,i saved all the data in an excelsheet...following are the values i got
fundamental(50)= -12.2dB
3rd harmonic(150)=-32.6dB
5th harmonic(250)=-45.4dB
7th harmonic(350)=-38.9dB
9th harmonic(450)=-39.4dB

Now convert these values to voltages. Divide the dB values by 20 and take the base 10 antilog (raise 10 to the power of the values). I get:

fundamental(50)= .2455
3rd harmonic(150)= .02344
5th harmonic(250)= .00537
7th harmonic(350)= .01135
9th harmonic(450)= .01072

Use the formula for THD(R) on this page:
https://en.wikipedia.org/wiki/Total_harmonic_distortion

I get a value of 11.6% distortion.

Keep in mind that this is the value you would get if all those glitches and noise were removed without changing the magnitude of any of the 3rd, 5th, 7th and 9th harmonics (such as a filter might do).

If you know the attenuation versus frequency of a filter you would use, you could apply that to the harmonics and get an approximation of the distortion after filtering. Or, you could actually apply the filter and again measure the FFT of the filtered waveform.

The TDS2012 only has 2500 sample points and its FFT is probably not without limitations, but at least you get a rough idea of your distortion.

Something else you might try is to turn on averaging on the scope. This lowered the noise floor of the FFT when I did it on my scope.
 
Last edited:
I have taken the input waveform from the same converter...F0016TEK.JPG...Though all the operating conditions are same(i.e. load,line,switching frequency)...Why is there a difference between the earlier waveforms(post 1 and post 5) and the current one???i am confused:thinker:..

What i mean to say is the earlier current waveforms(lower ones in post 1 n 5) appear more sinusoidal than the present one(lower one the pic attached in this post)..what is the reason for that???
 

My crystal ball doesn't show me how badly your coaxial probe measurements are. I hope your ground clip is very short or removed for tip & ring style probing.

I think THD is better expressed in dB relative to fundamental.

All you really need is the f1, f3, maybe f5 normalized to fundamental f1=0, thus...
f1=0
f3=-10.4 dB
f5=-33

THD = -10.38 dB which is pretty close to f3

but from your photos, the harmonic pulse noise N is dominant and in the range of -3 to -6dB
 

Status
Not open for further replies.

Part and Inventory Search

Welcome to EDABoard.com

Sponsor

Back
Top