Continue to Site

Welcome to EDAboard.com

Welcome to our site! EDAboard.com is an international Electronics Discussion Forum focused on EDA software, circuits, schematics, books, theory, papers, asic, pld, 8051, DSP, Network, RF, Analog Design, PCB, Service Manuals... and a whole lot more! To participate you need to register. Registration is free. Click here to register now.

Basic inductor equation question.

Status
Not open for further replies.

neddie

Full Member level 5
Joined
Feb 23, 2010
Messages
251
Helped
41
Reputation
82
Reaction score
35
Trophy points
1,308
Location
South Africa
Activity points
3,026
Hi to all.
Somewhere along the line I seem to have forgotten the basics :0(
Attached is a LTSpice cct of a voltage source , resistor and inductor. 1V , 0.01ohm and 100uH
Initially I was trying to calculate the effective inductance of an inductor in a buck regulator using the
ripple current , but I was coming out at double the value I expected , so I decided to sim it and see where I'm
going wrong.
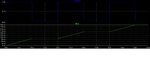
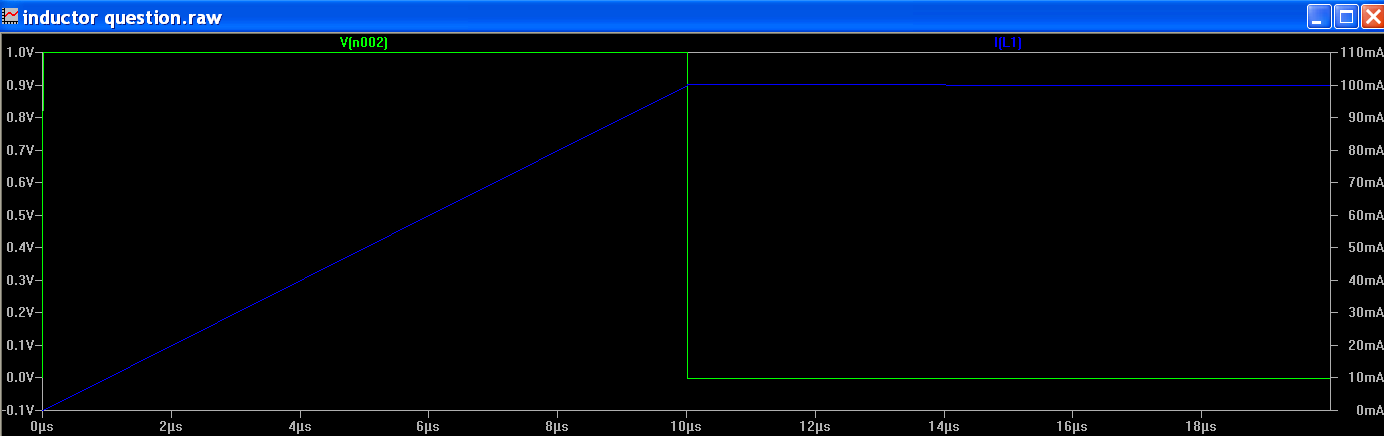
In the simulation if you zoom into the first voltage pulse(it may be easier here to only run the sim for 100uS instead of 100ms) you can see the inductor current goes from 0 to 100mA in 10us. This follows the formula perfectly as expected. V = L * di/dt. All good. If however you let the sim run to completion and zoom into
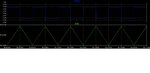
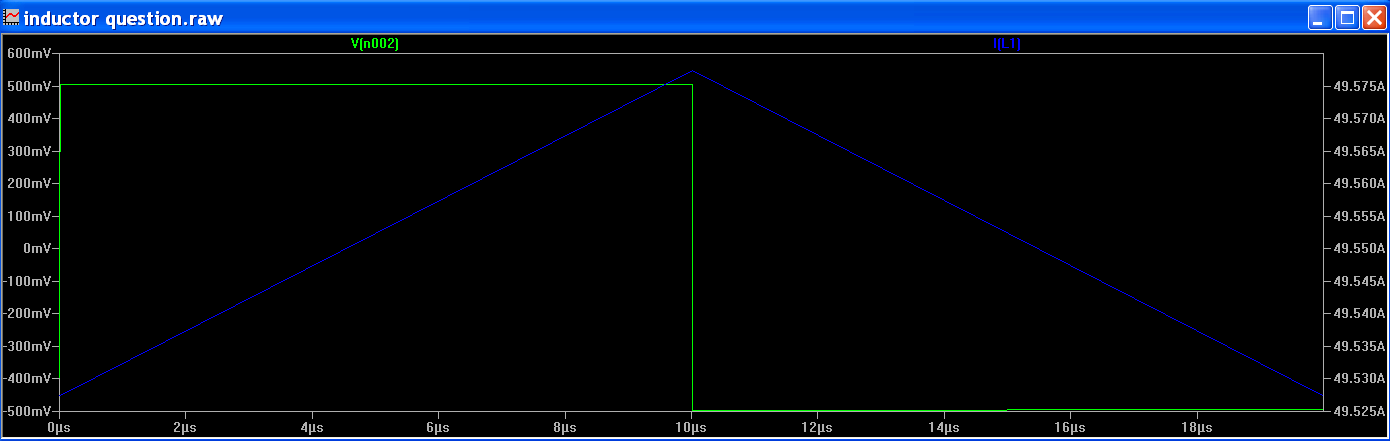
the waveform at steady state , say at 90mS it all falls apart. The voltage across the inductor goes from about -500mV to +500mV (Still 1 volt across the inductor) but the current only changes by 50mA , giving and inductance of 200uH.
Somewhere I've missed the boat!! Any good explanations.
Cheers
Neddie
 

Attachments

  • inductor question.zip
    473 bytes · Views: 46

Sorry , my explanation was not great. The voltage starts at 0 and goes to 1V in 10nS. The current will then ramp up linearly to 100mA in 10uS according to the inductor equation mentioned earlier.
 

You should understand better if you watch the inductor voltage and current over a full squarewave period, both at start and end of the simulation. I = ∫Vdt is fulfilled in both cases.
 

When your simulation does not appear as expected. Change the time scales of excitation, number of cycles and plot duration.
Like a scope, you want to view the steady state as well as transient , so adjust as required. The autoscale is not as good as a DSO.
Note L=V dt/dI , Asymptote towards V/R* duty cycle, and L/R time constant requires different time scales.
You can also view spectrum of voltage and current. Learn how Sim option affects results.
Then show your results when you have questions. The view settings are not contained in the .ASC file.

Here I changed the # cycles from 5 to 5000 and also showed the drop across the resistor using the probe on schematic on an added plot.
l.jpgl2.jpg
 

SunnySkyguy as there is no capacitance in the circuit, I can not see how you are getting "rings" on your wave form. The time constant of this circuit is L/R, or 10^-6, so in 5 X the time constant the current in the L is V/R or 100A. Before this time the current rises exponentially (like the voltage across a charging capacitor). So with a 1V battery, it is only the back EMF from the L that is opposing the current, so the voltage from the L must be R X the L charging current.
Or is my memory failing?
Frank
 

OP was
" trying to calculate the effective inductance of an inductor in a buck regulator using the ripple current "
, so PULSE had # cycles 5 to 5000 (PULSE(0 1 0 10n 10n 5u 10u 5000))

Note the autoscale does not put 0V and 0A at the same vertical axis if there is V undershoot, so I added 0.1A Imin to make them same.
l5.jpgl4.jpgl3.jpg

Also if you intend to zoom alot, Use Hammer icon to change number of Simulation points such as 1000.
(LSpice is primitive ,not like a real DSO)
 

You guys really are making things more complicated than they need to be. To look at things that are on different scales , just add another plot pane. Or you can zoom in and re-plot the relevant waveforms. You don't have to add any offsets and you certainly don't need to change and spice settings for something as basic as this.
Why anyone wants to do an FFT is beyond me. 2 imaged below to show how easy it is to view. 1 zoomed in to the beginning of the , the second at steady state.
 

Attachments

  • zoomed in 1.jpg
    zoomed in 1.jpg
    118.3 KB · Views: 63
  • zoomed in 2.jpg
    zoomed in 2.jpg
    130.8 KB · Views: 47
Last edited:

You guys really are making things more complicated than they need to be.

Then go back to the basics. What's unclear with these simple waveforms (first and last squarewave period of your simulation)?

In the former case, the inductor voltage levels are +1/0 V, resulting in +100 mA and -0 mA current ramp. In the latter, the voltage is +/- 0.5 V, respectively you see +/- 50 mA ramp. Where's the calculation problem?


Your input has DC+AC both equal in peak value. Vdc=0.5 + Vac=+/-0.5V = Vin

and the Voltage ripple was only +/-0.5Vp not 1V so you miscalculated L using 1V ripple.

I think this is all you forgot.

Next figure out the power dissipation in the resistance.
 

Status
Not open for further replies.

Similar threads

Part and Inventory Search

Welcome to EDABoard.com

Sponsor

Back
Top