Continue to Site

Welcome to EDAboard.com

Welcome to our site! EDAboard.com is an international Electronics Discussion Forum focused on EDA software, circuits, schematics, books, theory, papers, asic, pld, 8051, DSP, Network, RF, Analog Design, PCB, Service Manuals... and a whole lot more! To participate you need to register. Registration is free. Click here to register now.

photovoltatic model simulation in proteus

Status
Not open for further replies.

h1368

Newbie level 2
Joined
Mar 12, 2013
Messages
2
Helped
0
Reputation
0
Reaction score
0
Trophy points
1,281
Activity points
1,296
hello
this is my first post in this forum.
I have designed an MPPT (maximum power point tracker) in proteus and need Photovoltatic model for test the circuit .
I know PV model consist of diode and current source but i pick those model from proteus's Library and the result of it is not correct for me
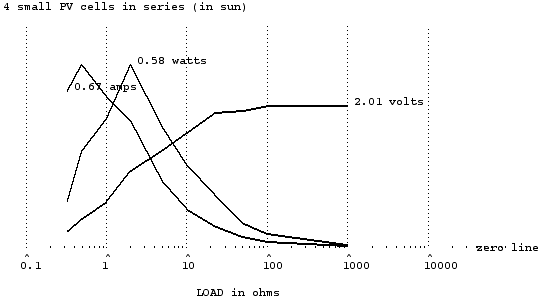
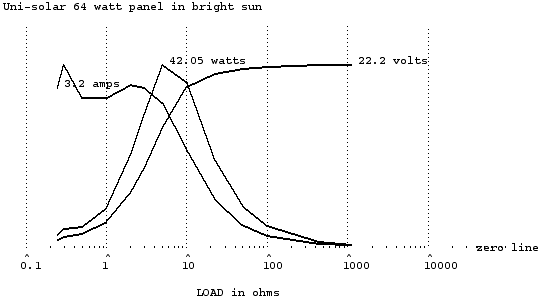
the I-V characteristic is like below picture
max_power.jpg
i found a diode model in proteus that i think , it can help me but don't know how set advanced properties .
proteus2.JPG
 
Last edited:

A PV panel can produce its maximum voltage at low current, or its maximum current at low voltage.

Its greatest watt output is at a middle point on the graph.

The best model I have been able to come up with is a voltage source and a resistor inline. If the panel is rated 12V, then I make the voltage source 19 to 22V (a realistic figure). I adjust the resistor value so that it will send the expected amount of amperes into a 12 V battery. If the panel is rated low W then I use a higher resistance. If the panel is rated high W then I use a lower resistance.

I believe this is sufficiently realistic, in the sense that (a) it has the ability to charge a battery bank (or capacitor) to the panel's maximum output voltage if left connected indefinitely, and (b) it has current limiting.

I used this model before but need a non-linear I-V characteristic like the figure im my last comment.
Because i am using ( Perturbation&Observation ) method for tracking maximum power point and the program that i wrote is just for non-linear I-V.
If i use a linear model like voltage source and resistor , the output W result is not maximum and it's wrong .
 

Right, it's because the MPPT needs a model that behaves like a real PV panel.

To show what to aim for...

Here is real data I measured from PV cells. I hooked up various ohm loads and read the resulting volt level.
Then I devised a computer program to calculate amperes and watts, and plot all the data.

Four small cells wired in series:


Three graphs are superimposed: V, A, W.
The peak in the middle shows maximum power output (0.58 W) occurs with a 2 ohm load.

A 64W panel:


The maximum power plot looks as though it is missing its rounded peak. That tells me I should have tested it with loads between 5 and 10 ohms. Because I think I could have gotten 50W into an 8 ohm load.

The plots are crooked where I drew maximum amps. The connection may have been bad, etc.

The above data can give us something to shoot for, in simulating a PV panel.
 

Status
Not open for further replies.

Similar threads

Part and Inventory Search

Welcome to EDABoard.com

Sponsor

Back
Top