Alan0354
Full Member level 4
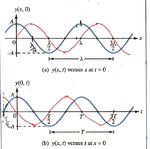
A sine wave traveling in +x direction can be represented by \[\cos(\omega {t}- kx+\phi)\].
As shown in the drawing attached where \[ \phi=\frac{\pi}{2}\]:
a) Is a plot that holds t=0 and two waves along +x direction.
\[t=0\Rightarrow\; \cos(\omega {t}- kx+\phi)\;=\;\cos(- kx+\frac{\pi}{2})\]
This implies maximum at \[-kx+\frac{\pi}{2}\;=\;0\]
\[k=\frac{2\pi}{\lambda}\;\Rightarrow\; \frac {2\pi}{\lambda}x=\frac {\pi}{2}\;\Rightarrow\;x=\frac{\lambda}{4}\]
This gives the wave form in RED that LAGs the [itex]\cos(\omega{t}-kx)[/itex].
b) Is a plot of the waveform at x=0 and the two waves vary with time t.
\[ x=0\;\Rightarrow\; \cos(\omega {t}- kx+\phi)\;=\;\cos(\omega{t}+\frac{\pi}{2})\]
This implies maximum at \[\omega{t}=-\frac{\pi}{2}\]
\[\omega{t}\;=\;\frac{2\pi}{T}t\;=\;-\frac{\pi}{2}\;\Rightarrow\;t=-\frac{T}{4}\]
This means waveform in RED LEADs the original wave.
So the two cases give opposite result. Can anyone explain this to me?
Thanks
Alan