Continue to Site

Welcome to EDAboard.com

Welcome to our site! EDAboard.com is an international Electronics Discussion Forum focused on EDA software, circuits, schematics, books, theory, papers, asic, pld, 8051, DSP, Network, RF, Analog Design, PCB, Service Manuals... and a whole lot more! To participate you need to register. Registration is free. Click here to register now.

How to identify 'spike' automatically during data acquisition

Status
Not open for further replies.

tenderne

Member level 2
Joined
Jan 9, 2007
Messages
46
Helped
0
Reputation
0
Reaction score
0
Trophy points
1,286
Activity points
1,621
Dear All,

It seems to be a 'weak' problem, but it really troubles me couple of days.

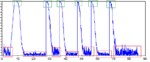
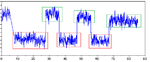
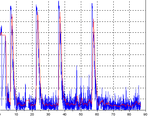
My problem is, I got some sets of real-time data from sensor, please see the attachment. Suppose I don't know the so-called 'threshold' value highlighted by red box, how to identify the 'spike' highlighted by green box?

Any hint would be much appreciated. thanks a lot in advance.

Best regards,
tenderne
 

Attachments

  • q1.png
    q1.png
    7.2 KB · Views: 159
  • q2.png
    q2.png
    6.3 KB · Views: 160

Take a moving averge (lowpass filter) followed by a peak detector to discriminate between the red and green box conditions
 

Dear klystron,

Thank you very much for your suggestion.

Actually I have tried moving average, after that a similar signal pattern is generated. however, with unknown threshold, I still cannot identify the 'spike' or 'peak'. please see attachment. in the figure, blue curve is original signal, red curve is the one after moving average.

Would you please elaborate more about the 'peak detector', assuming that we know nothing about the threshold? thanks a lot.

best regards,
tenderne
 

Attachments

  • q1_more.png
    q1_more.png
    17.7 KB · Views: 147

Calculate the slope (1 st derivitive) The peak occured where the slope change sign
 

Dear klystron,

Thank you very much for your suggestion.

Actually I have tried moving average, after that a similar signal pattern is generated. however, with unknown threshold, I still cannot identify the 'spike' or 'peak'. please see attachment. in the figure, blue curve is original signal, red curve is the one after moving average.

Would you please elaborate more about the 'peak detector', assuming that we know nothing about the threshold? thanks a lot.

best regards,
tenderne

This low pass filter is good for instantaneous data value (it filter noise). For running average use another low pass filter with a much lower pass band.
A similar algorithm is used for capacitive touch detection (search on Microchip web site, mTouch application notes describes this algorithm)
 

Status
Not open for further replies.

Part and Inventory Search

Welcome to EDABoard.com

Sponsor

Back
Top