roadking7755
Newbie level 2
Hi all,
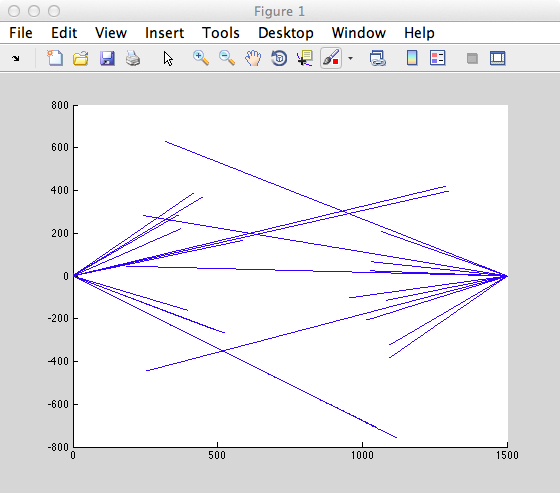
I'm working on a project and was wondering how to plot multiple 3D lines on one grid. I have the 2D done and attached, but when I add a third dimension to plot3 it still shows a 2D plot like the one attached. Thanks
This is what I'm calling to try and draw the 3D lines, which has three arrays all the same length:
hold on
for i=1:length(mt)
plot3(mt(i).position_x") ), mt(i).position_y), mt(i).position_z)); %plot MTs
), mt(i).position_y), mt(i).position_z)); %plot MTs
end
hold off
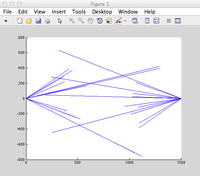
I'm working on a project and was wondering how to plot multiple 3D lines on one grid. I have the 2D done and attached, but when I add a third dimension to plot3 it still shows a 2D plot like the one attached. Thanks
This is what I'm calling to try and draw the 3D lines, which has three arrays all the same length:
hold on
for i=1:length(mt)
plot3(mt(i).position_x
), mt(i).position_y), mt(i).position_z)); %plot MTsend
hold off
Attachments
Last edited: