Continue to Site

Welcome to EDAboard.com

Welcome to our site! EDAboard.com is an international Electronics Discussion Forum focused on EDA software, circuits, schematics, books, theory, papers, asic, pld, 8051, DSP, Network, RF, Analog Design, PCB, Service Manuals... and a whole lot more! To participate you need to register. Registration is free. Click here to register now.

ADS- Multi Band Antenna

Status
Not open for further replies.

antennadesign54321

Member level 1
Joined
Nov 14, 2010
Messages
34
Helped
1
Reputation
2
Reaction score
0
Trophy points
1,286
Activity points
1,530
Hi Guys,
In a microstrip antenna, i want to make a limited ground plane + i want to place a small rectangular conductor on the back side . Can you please let me know how do we do that.

Please see the attached image.
Dual Band.jpg

Thanks for your help.

Regards,
 

choose cond2 and draw the ground plane..

open substrate editor

click the bottom conductor

change the cover option to strip plane

Then map the bottom conductor to "cond2"
 
Hi theepak,
thanks for your response. I understood the ground part, but what about having a small conductor also on the back side. From the figure above it looks ground & conductor(on back) is on same level ? is it ?

thanks again.
 

In my design i have used lamda/4 strip in the ground plane to introduce notch in the desired frequency

In ur figure they are in same level..

It is to introduce notch in the operating frequency

u can read art and science of UWB antenna by schantz
 

Hi theepak,thanks for referring me this book. i will check it out.. Btw, do you know how to put the conductor on the same lower ground plane ?
 

The ground plane which ur drawing in "cond2" is also a conductor
just draw that above conductor in "cond2" layer...
 

Ok.
I have 1 more question. How to see the current distribution using ADS & what observations should be made from that ?
 

Using current distribution u can have an idea at the coressponding frequency which part of the antenna is active..

for Ex.. consider ur designing a notch in the UWB frequency using a spilt ring resonator.

The surface current ll be concentrated around the spilt ring in the notch frequency .

I have done using CST. But in ADS i am not sure..

---------- Post added at 10:32 ---------- Previous post was at 10:30 ----------

But if there is no option in ADS,
U can try to export H-field..Then try to use j=n*H.
 

How to see the current distribution using ADS

ADS Momentum is based on the Method of Moments, which solves for the currents on conductors.
In ADS 2009, you can see current densities with Momentum > Post-Processing > Visualization
 

Hi Volker
thanks for your response. Actually i have designed a multiband antenna for 2 to 4 Ghz , iam getting the S(1,1) less than -10 dB in the range . My faculty has asked me to show the current distribution at different frequencies say 2.3 Ghz, 2.5 Ghz ,3.4 Ghz.

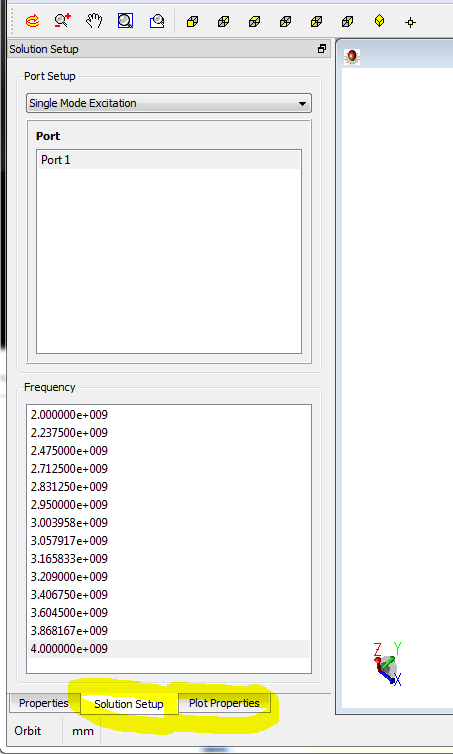
I used Momemtum->postprocessing->visualization .. I see only the layout of my antenna with ALL in BLUE . I dont see any current moving or anything of that sort, I'm getting the radiation pattern which is fine.

Can you please let me know how to go about it ?

its very urgent for me as i have to compile my result and submitt to my faculty asap.

thanks again for your time.
 

Have you checked the Solution Setup tab for frequency and Plot Properties for scale?

45_1326374063.png
 

Hi Volker,
I checked the Plot Properties, & yes now iam able to see some current. What i noticed that when i check the box 'Log Scale' then the current is much more visible than when its not checked. What does that say ? this was the reason i wasnt able to see the current before.

Also , Can we also see the Gain in 3 Dimensional View.?
 

Hi Volker,
Yes, i got the 3-dimensional radiation pattern of the antenna, What i mean i that i want to calculate the GAIN of the antenna at different frequencies ? say from 0-6 Ghz .? Can i plot it ?

Also i was trying to plot the different values of VSWR , so in the plot results page, i used the EQUATIONS , and wrote y=vswr (S(1,1)) , but when iam checking the values of VSWR , they frequencies selected by it are like .73Hz, 73Hz,730Hz and so on , Can i select at what points i should have a Frequencies ( & hence VSWR calculated)).


In short i already have S(1,1) from 0-6 Ghz for all values in a form of a chart , I also want the same for the VSWR , and Gain .

I really appreciate you for your time.

Regards,
 

I have to leave these questions to other forum members, because I don't use Momentum myself.
 

If u like to change the frequency points u can change simulation step size.
 

thanks theepak, Also i wanted to plot the Radiation pattern , Gain, VSWR Vs Frequency. I'm having a hard time doing so. Can you please let me know how can this be achieved.. I have got the S(1,1) results from 1 to 6 Ghz , I want to plot the Gain, VSWR, for the Same Frequency , and Radiation Pattern(2D) for these specific Frequencies.

Thanks
 

For VSWR u can do in two ways,
using Equations u can do . otherwise export the S parameter and use excel or MATLAB to find VSWR from S-parameter.
Gain i dunno how to do..u can note down the max gain in each frequency and use Matlab to plot
 

Status
Not open for further replies.

Part and Inventory Search

Welcome to EDABoard.com

Sponsor

Back
Top