Vermes
Advanced Member level 4

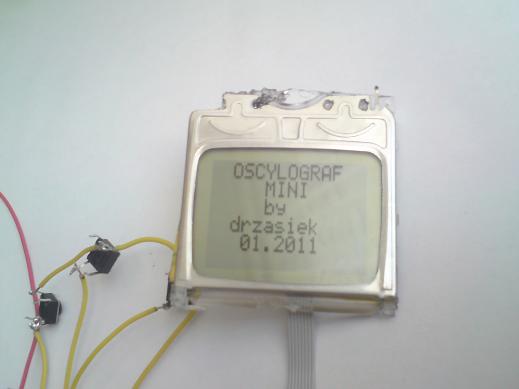
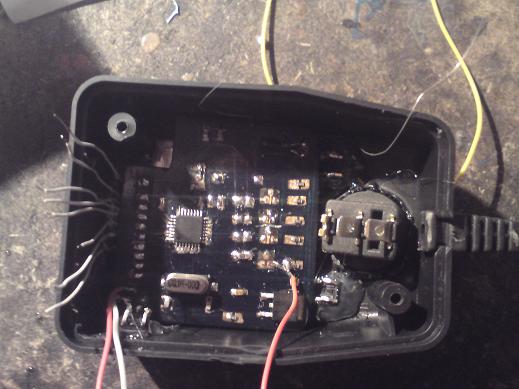
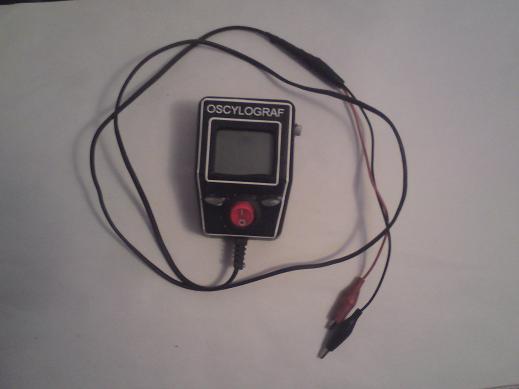
This device uses LCD from Nokia 3310. It is a graphic recorder of voltages based on microcontroller Atmega8A-AU and its internal converter A/C. The analyser is similar to a digital oscilloscope, but the differences are the limitations of converter frequency and uC in the analyser. Atmega is clocked by external quartz 16MHz. The aim was to build a simply and portable headheld diagnostic device. It may serve as both oscillograph and voltmeter.
Measurement range
A voltage divider with transmission of 1:12,5 was used, so the measurement range is from 0 to 62V. Because of the frequency limits at 10bit of resolution, the tests showed right indications of the time to about 2KHz (it is little, but enough for registration of voltages in a car and checking the quality of stabilization).
Functions
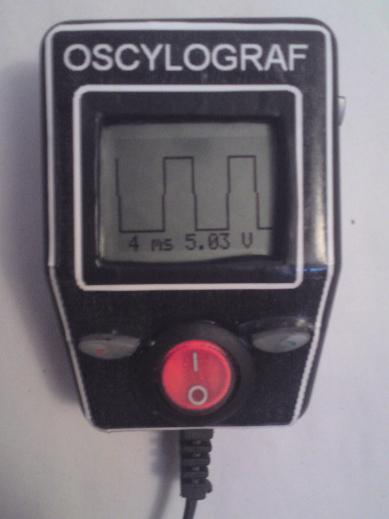
After starting, the device shows start screen (device name, author of the project and date of execution) and immediately goes into measurement mode, displaying the voltage waveform. At the bottom of the screen the basis of time is shown (in ms on the entire width) and amplitude of the waveform in V. There is no need to set the gain (there is no amplifier) in the sense of the height of the course (Y), because the course itself adapts to the screen height (maximum value of the measurement is at the top, the other values proportionally). Using the buttons right and left, the basis of time can be changed and the OK button is used to stop the measurement and display a steady course on the LCD. After pressing the OK button again, the device returns to the dynamic visualization. Also buttons right or left may be pressed in the mode of detained measure. Then the cursor appears, which can be positioned by those buttons. After pressing OK, another cursor appears, which also can be positioned. While positioning the second cursor, time from one cursor to another one is displayed at the bottom of the screen (to calculate the time of the pulse, rise/fall time, etc.). By selecting the entire period between the cursors and pressing OK, a time value calculated into the frequency appears at the bottom of the screen. Then, pressing OK results in returning to the dynamic visualization.
Construction
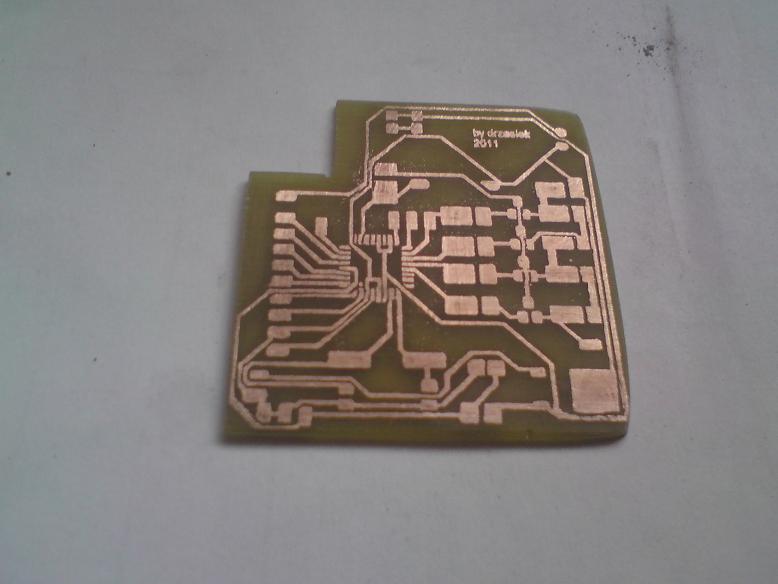
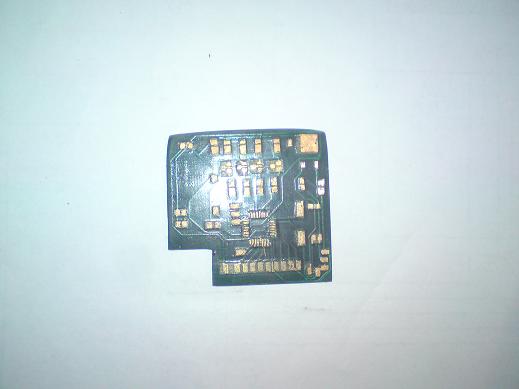
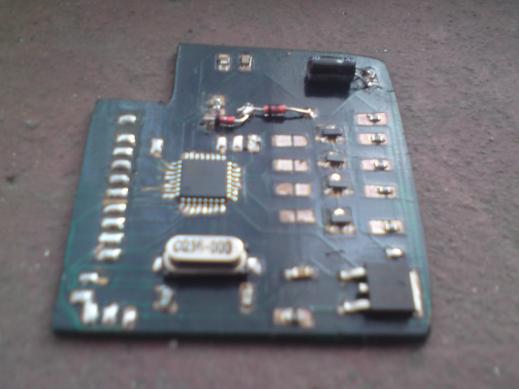
The program was written in C, Atmega in TQFP-32 housing. The board was made in thermal transfer method. SMD components manually soldered. Z92 housing. The device is powered by battery 9V, stabilized to 5V, current consumption is about 10mA.
Link to original thread (videos and attachment) – Graficzny analizator napięć - OSCYLOGRAF cyfrowy MINI
Last edited: