Continue to Site

Welcome to EDAboard.com

Welcome to our site! EDAboard.com is an international Electronics Discussion Forum focused on EDA software, circuits, schematics, books, theory, papers, asic, pld, 8051, DSP, Network, RF, Analog Design, PCB, Service Manuals... and a whole lot more! To participate you need to register. Registration is free. Click here to register now.

how to plot Cap vs Vgs in cadence spectre?

Status
Not open for further replies.

singhji0000

Junior Member level 3
Joined
Apr 1, 2011
Messages
27
Helped
0
Reputation
0
Reaction score
0
Trophy points
1,281
Activity points
1,464
i am doing ac analysis for vermis 18 rf component for varactor.gate connected to vdc source and other terminals source body drain shorted and connected to ground. i have set sweep parameter in ac analysis as voltage at desired frequency of 1 GHz and giving desired range of voltage.

Now after netlist and run, i want to plot cap vs vgs curve.

C = Idc/(2*pie*freq*vgs). how to carry out these steps in calculator one by one .Please help me by giving steps in details.

thanks
manjeet
 

Why do you insist on using AC analysis to pick off a C value? Are you looking
for an "effective C" that embeds the resistances and so on?

If you want the Cgg of a MOS varactor, use parametric analysis and a DC OP
(which is what feeds the AC analysis its component values anyhow) and
just plot OP() with the gate capacitance(s) picked and summed or use Cgg
as the sum (which it is, C of gate to all).
 

Hi,

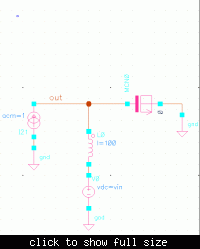
I plot the CV curve in following way with AC analysis.

Initiate the ac analyis at one frequency and vary the control voltage. Plot the CV curve of MOS varactor (e.g at 1GHz) using the following formula.

(-1 / (2 * pi * 1000000000 * imag(VF("/out"))))

See the circuit diagram attached with the msg. 100H ideal inductor is there to prevent any ac signal to get shorted to ground by dc source.
 

Why do you insist on using AC analysis to pick off a C value? Are you looking
for an "effective C" that embeds the resistances and so on?

If you want the Cgg of a MOS varactor, use parametric analysis and a DC OP
(which is what feeds the AC analysis its component values anyhow) and
just plot OP() with the gate capacitance(s) picked and summed or use Cgg
as the sum (which it is, C of gate to all).

How do you perform parametric analysis in Virtuoso? I only see DC analysis, so I sweep the parameter I want. However if I evaluate the OP() statement I only get one value that is the one associated with the single DC operating point set by the components, not the sweep from the DC analysis. Any ideas?
 

Analog Environment menus, Tools > Parametric Analysis
should pop the parametric analysis control thingy.

Unless Cadence has found a way to charge you ala
carte and your CAD people didn't want to pay....
 
Got it. Thanks!
Now I have two more questions:
1. How do you generate multiple curves for the initial C value parametric sweep? (i.e. if I want to sweep another variable and see what effect it has on the C)?
If I put another variable in the parametric control thingy I get two separate plots. One for each C value with respect to each variable. What I am looking for is to do an embedded sweep (i.e. sweep over one variable, then step the second variable and sweep again with respect to the first variable and so on)
2. Is there a way I can plot the data over function of the actual variable (i.e. I want to plot C over Vov and not Vgs but I am actually sweeping Vgs, all I want to do is make the X-axis a function of Vgs)?
Thanks,
 

Status
Not open for further replies.

Part and Inventory Search

Welcome to EDABoard.com

Sponsor

Back
Top