Welcome to our site! EDAboard.com is an international Electronics Discussion Forum focused on EDA software, circuits, schematics, books, theory, papers, asic, pld, 8051, DSP, Network, RF, Analog Design, PCB, Service Manuals... and a whole lot more! To participate you need to register. Registration is free. Click here to register now.
AWGN stands for "Additive White Gaussian Noise" and can have any standard deviation. It is theoretically flat in frequency spectrum from 0 to infinite.
so, for standard theoretically is 1 and flat to infinite frequency. i also confuse with the figure. can someone axplaine me the difference?
---------- Post added at 08:26 ---------- Previous post was at 08:24 ----------
so, for standard theoretically is 1 and flat to infinite frequency. i also confuse with the figure. can someone axplaine me the difference? https://obrazki.elektroda.pl/18_1296955349.jpg
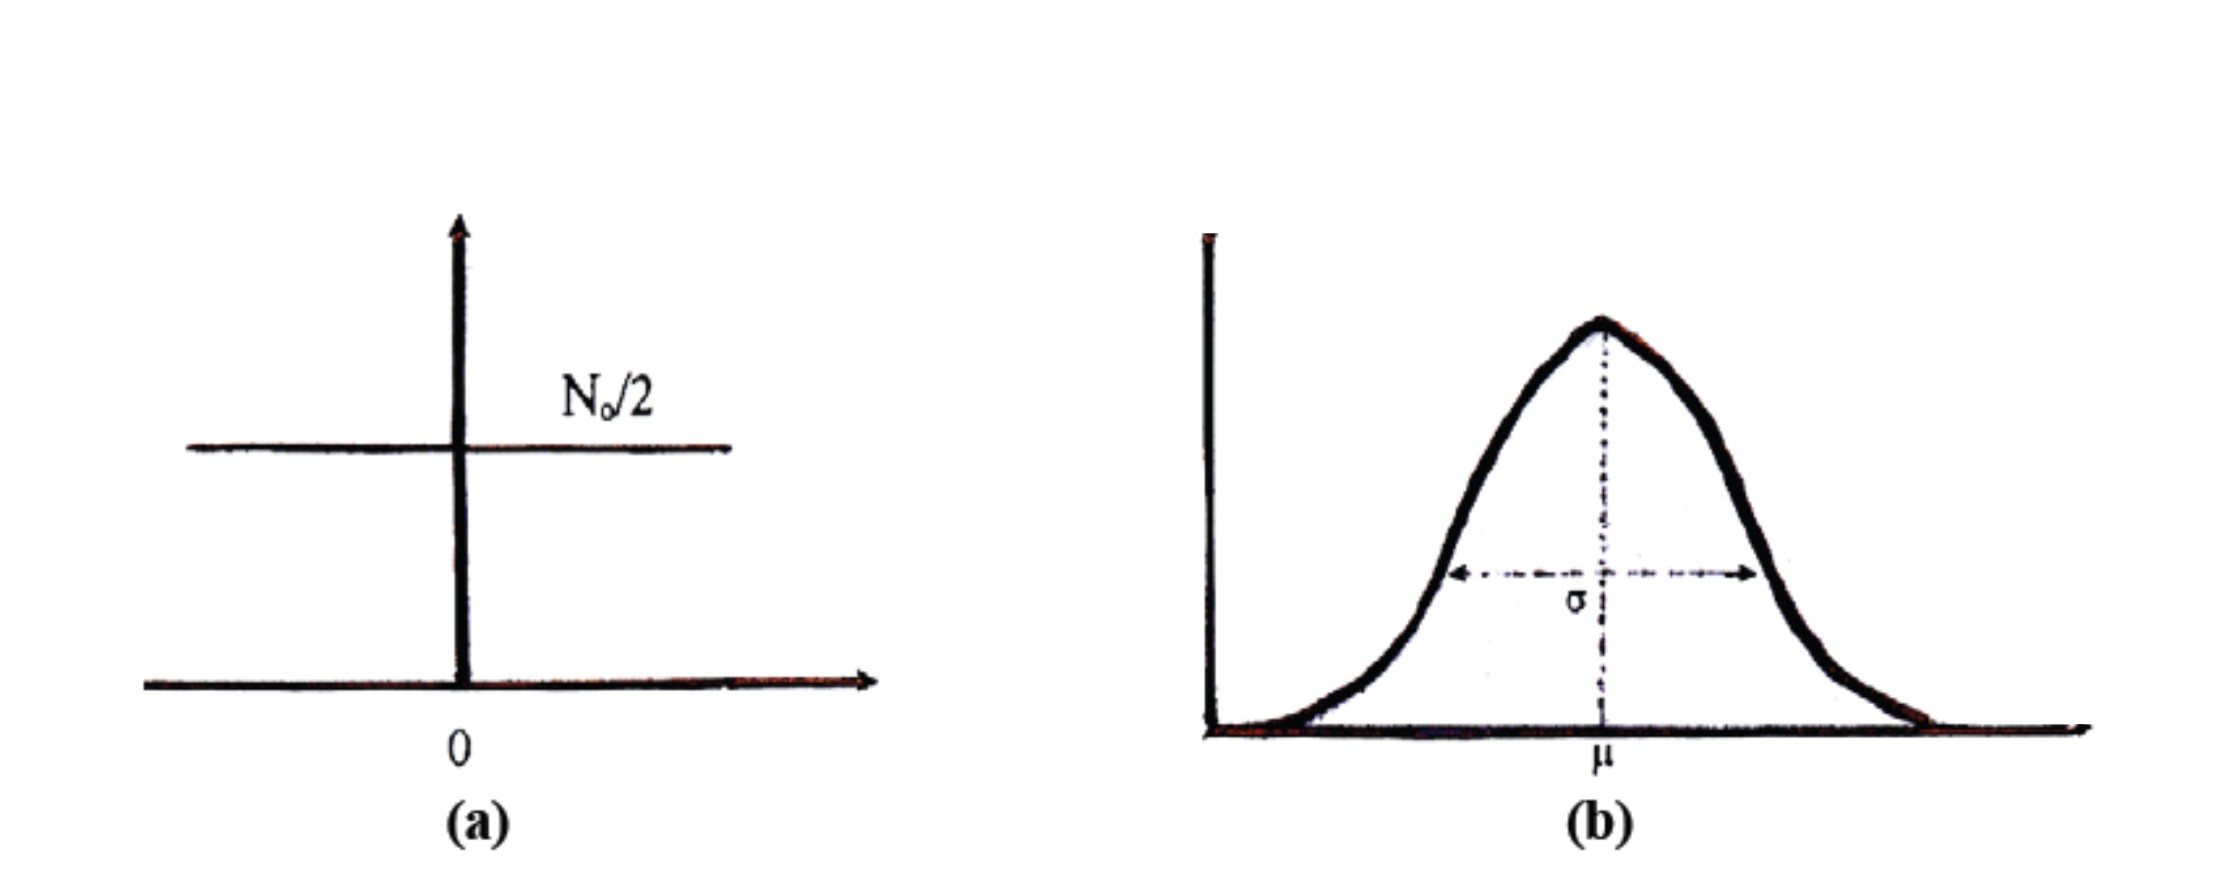
The figure on the left is the PSD (power spectral density) of white noise; this represents the constitution of noiser per HZ (how much noise in every frequency), the figure on the right is the PDF of the noise (Probability density function); which represents how a certain value of noise sample is likely to occur.
so, white noise has constant value? but i've read that AWGN has random distributed noise...
what is relation that figure with characteristics of AWGN? (additive, white, gaussian noise)
which noise has constant value, which one is random?
additive= its the noise that we add to our signal , to account for the noises during its propagation,
white= like white light has all colors, white noise is combination of noises of all frequencies.
guassian= its pdf(probability density function )has guassian distribution[the shape on the right side]
noise= WELL because its noise(unwanted oscillations!!)
Yes, if the figure on the left wasn't constant, then noise samples are correlated (This means that the noise at times t1 and t2 are dependent) because the autocorrelation function won't be an impulse, the gaussian pdf shows the probability of the noise value to take certain value, gaussian noise may be colored (not necessarily white).
This site uses cookies to help personalise content, tailor your experience and to keep you logged in if you register.
By continuing to use this site, you are consenting to our use of cookies.
")