Continue to Site

Welcome to EDAboard.com

Welcome to our site! EDAboard.com is an international Electronics Discussion Forum focused on EDA software, circuits, schematics, books, theory, papers, asic, pld, 8051, DSP, Network, RF, Analog Design, PCB, Service Manuals... and a whole lot more! To participate you need to register. Registration is free. Click here to register now.

shape of smith chart.. what does it mean?

Status
Not open for further replies.

doubty

Newbie level 3
Joined
Dec 11, 2009
Messages
4
Helped
0
Reputation
0
Reaction score
0
Trophy points
1,281
Activity points
1,307
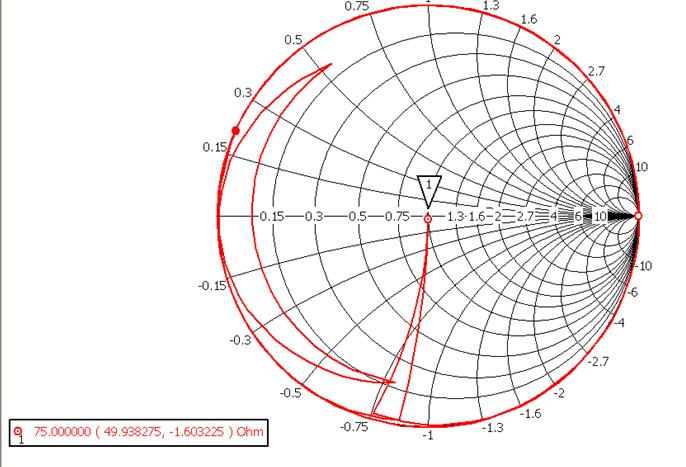
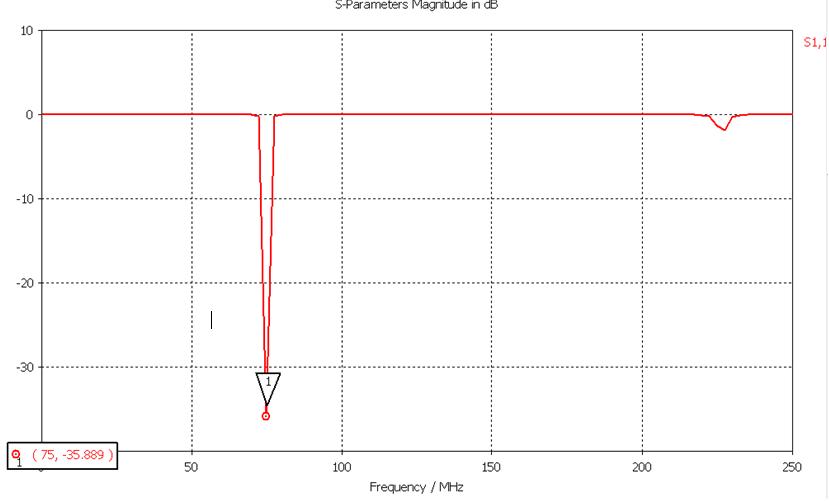
i want to match an impedance to 50 ohm. i simulated a stub matching network using cst and saw the smith chart. At my required frequency there was good match but, the shape of the smith chart (its connecting impedances at various frequency) was like a sharp spike. the tip of the spike is at 50 ohm at my freq and the spike is coming out from a circle at the edge of the smith chart. What does this indicate?
 

1) Bad calibration;
2) Insuficent number of points.


Mandi
 

so it is not ok? why do you say that it has to be an error? is it not possible that this IS the actual path of variation of impedance wrt frequency and if it is the actual path then could this shape indicate some particular characterisitc of my matching component?
 

I understood you trace goes out from the Smith chart. This is not possible for passive networks since it indicates negative resistances. It is instead possible for active circuits. So just like FANT I suspect you are using an insufficient number of points or, since your circuit is simulated, a poor meshing. Could you attach an image of you graph and circuit ?
 

here is the smith chart:

As u can see nothing is going out of the chart. so no problem of active stuff. i will also put a pic of magnitude of s11 (dB) vs freq i obtained for the same freq range here:
 

OK it seems to me you are analyzing a wide frequency range but you defined an insufficient number of points. This because a see 3 spires in the Smith chart.
It is also very strange that you have an almost perfect matching at your frequency.
 

3 spires? wats that?
this was designed using mimp and later optimized using optimize tool of cst ds to obtain a good match at my frequency. i guess thats ok.
 

Status
Not open for further replies.

Part and Inventory Search

Welcome to EDABoard.com

Sponsor

Back
Top