Continue to Site

Welcome to EDAboard.com

Welcome to our site! EDAboard.com is an international Electronics Discussion Forum focused on EDA software, circuits, schematics, books, theory, papers, asic, pld, 8051, DSP, Network, RF, Analog Design, PCB, Service Manuals... and a whole lot more! To participate you need to register. Registration is free. Click here to register now.

How much does reducing power reduce the conducted EMC scan plot?

Status
Not open for further replies.
T

treez

Guest
Hello,
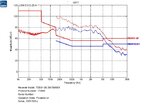
Our 150W Offline LED driver has failed EMC (conducted) by 10dB at around 150kHz.
If we operate it at 50W, will it pass?

(10dBuV drop means three times less voltage and so operating the product at three times less power means we will pass?)

Its a controlled linear current regulator, and not SMPS based.
 

Hi,

EMC or EMI?

with EMI you might have a chance, but I doubt with EMI.

Klaus
 

Thanks, The attached is our EMC scan fail. The product was operated at 150W for this. It is an offline product with no mains filter. (It is not an SMPS but has linear regulators)
If we operate it at 50W, then I would assume that I can in some way calculate how much lower this conducted EMC plot will come down?
I have the data points for the plot, in an excel file (dBuV vs Frequency)

I will first convert all dBuV points to volts.
I will then divide each voltage value by (150/50)^2 = 9.

(..because power is proportional to voltage^2)

I will then reconvert this to dBuV and re-plot the dBuV vs frequency graph…..i assume this will roughly give me the plot that we would get if we operate the product at a power level of 50W?
 

Attachments

  • EMC scan conducted emissions.jpg
    EMC scan conducted emissions.jpg
    84.3 KB · Views: 116

Status
Not open for further replies.

Similar threads

Part and Inventory Search

Welcome to EDABoard.com

Sponsor

Back
Top