derick007
Newbie level 5
I am trying to understand how the spectrum analyser in SIMULINK (MATLAB) works, by simulating a model which inputs a simple cosine wave into the spectrum analyser and then observing the power spectrum on the analyser. I have set the WINDOW function in the anayser to RECTANGULAR and the sampling frquency to 20 times the frequency of the cosine wave. Therefore if I set the simulation time and therefore WINDOW length (time) to one period of the cosine wave the analyser will get N=20 samples.
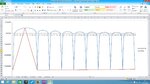
I have used EXCEL to manually calculate the power spectrum values for N = 20 and used the same resolution bandwidth as the analyser and plotted them on a graph along with the SIMULINK results - see attachment.
How can the SIMULINK analyser plot such a detailed graph with only N = 20 samples ?
I have used EXCEL to manually calculate the power spectrum values for N = 20 and used the same resolution bandwidth as the analyser and plotted them on a graph along with the SIMULINK results - see attachment.
How can the SIMULINK analyser plot such a detailed graph with only N = 20 samples ?