fabibzh
Newbie level 3
Hello,
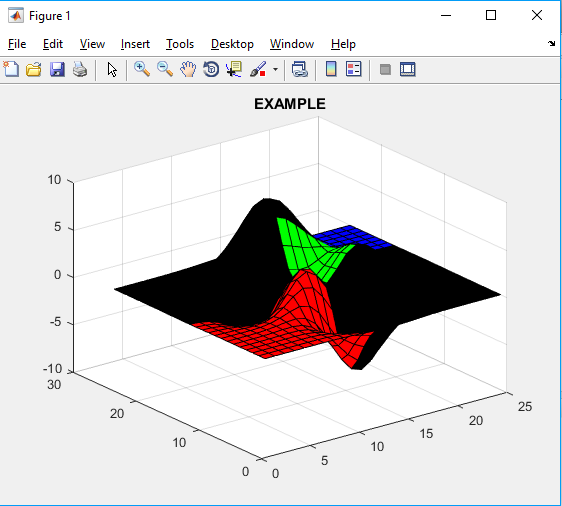
I am calculating Radar Cross Section with matlab. My results are correct, i want to plot these results.
I have 2 input variables.
I use the "surf" function.
Following RCS values, i want to color the curve. For example, for RCS = -5 to -2, the curve will be yellow, for RCS = 10 to 20, orange, ... I don't know how to do it. :bang::bang:
Can you help me ?