Continue to Site

Welcome to EDAboard.com

Welcome to our site! EDAboard.com is an international Electronics Discussion Forum focused on EDA software, circuits, schematics, books, theory, papers, asic, pld, 8051, DSP, Network, RF, Analog Design, PCB, Service Manuals... and a whole lot more! To participate you need to register. Registration is free. Click here to register now.

Output Power Calculation over Wideband Signal at Spectrum Analyzer

Status
Not open for further replies.

Politecnico

Member level 1
Joined
Aug 28, 2013
Messages
34
Helped
1
Reputation
2
Reaction score
1
Trophy points
8
Activity points
316
Hi

Pout.png

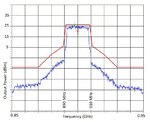
The picture above is the RF signal (with central frequency= 0.9 GHz) with the LTE baseband signal (at 20 MHz).

Could anybody tell me, by having the plot at the Spectrum Analyzer, how we may calculate the total power of the signal throughout the whole bandwidth (over 20 MHz)

Thanks a lot for any hint, in advance
Politecnico
 

There are two definitions for these kind of signals.
"Peak Power" and "Average Power".Modern SA's can calculate these powers easily.
But "Peak to Average" value should be mentioned in its specifications in dB.
 

Using an Average Detector rather than a Peak, you can estimate the average Power (dBm or mW) by taking the mean or average detected level;

Pt =P{dBm} + 10log (BW/RBW) or
Pt =P{mW} * 10log (BW/RBW)

Pt =total rms power of spread spectrum signal
P= mean Power integrated or avg. in RBW
BW= Signal BW @-10dB approx.
RBW=Resolution BW or Noise BW

Also you can dump all the power data, Pk in mW and compute the Product Sum of k points
Pt=10log ∑{Pk{mW}*SPAN}
. . . . . . . . . . . (RBW*k)

for k= number of data points
SPAN = BW of Data for all k data points
RBW=Resolution BW or Noise BW
 
Hi, SunnySkyGuy,
Could you give an example?
Thanks.
 

Initial question, let's say the RBW= 100kHz. {assumption} The Red marker is the limit 26dBm of this spectrum and -10dB BW is 20MHz.
Therefore the total Power , Pt is;

Pt= 26+ 10log (20M/100k) = 26+23.01=49dBm =~ 100W { err. Fixed}

Now explain Power Density of Spread Spectrum and how RBW affects result.
 
Last edited:
Using an Average Detector rather than a Peak, you can estimate the average Power (dBm or mW) by taking the mean or average detected level;

Pt =P{dBm} + 10log (BW/RBW) or
Pt =P{mW} * 10log (BW/RBW)

Pt =total rms power of spread spectrum signal
P= mean Power integrated or avg. in RBW
BW= Signal BW @-10dB approx.
RBW=Resolution BW or Noise BW

Also you can dump all the power data, Pk in mW and compute the Product Sum of k points


for k= number of data points
SPAN = BW of Data for all k data points
RBW=Resolution BW or Noise BW

Can you show a reference for that calculation?? It seems to me a little bit weird..
 

image.jpg < from
It took me a while to find someone else who documented this for spread spectrum or a"Noise like Signal"

The only difference is they use data points starting from k=0, so the denominator is k-1.

The other salient detail is this must be an Average type detector selected. Old SA's with only peak detectors read approx 2.5 dB higher than average so a correction factor is applied if applicable. If the RBW≠NBW then the Noise BW is used instead. Also the RBW ought to be ~2% of the Symbol Rate and the Video filter 10% of the RBW to get a precise smooth result.

Below you see constant Power with increasing SS % When the signal,BW doubles the Spectral Density drops 10log(0.5) or -3dB.
image.jpg

Looking at the Op's example -10dB skirt BW was used to define 20MHz Signal BW. Others only use the -3dB BW and neglect below for this approximation, while the computed ∑ total is the precise Pt.
 

Attachments

  • image.jpg
    image.jpg
    57.9 KB · Views: 164
Status
Not open for further replies.

Part and Inventory Search

Welcome to EDABoard.com

Sponsor

Back
Top