muhammad.usman
Newbie level 6
- Joined
- Aug 1, 2012
- Messages
- 13
- Helped
- 0
- Reputation
- 0
- Reaction score
- 0
- Trophy points
- 1,281
- Location
- Togher, Cork, Ireland, Ireland
- Activity points
- 1,371
Hi,
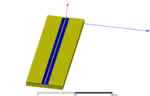
I am simulating a multilayer semiconductor wave guide structure with metal on top in HFSS which is a straight wave guide as shown in picture 1.
I have to do impedance measurement using TDR but I dont understand how does it work. I am doing the interpolating sweep and normalizing the ports too which are the requirements to do TDR in HFSS (according to HFSS help).But is it the right way to do it?
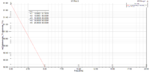
Another question is that after normalization of port with 50 ohms the port impedance should be 50 on all the frequncies but in my simulation it jumps to 51.4 ohm at dc frequency i.e. 0.01 GHz
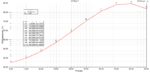
I am attaching both the TDR Impedance plot (measured using TDR) and also the port Impedance plot (after normalizing).
I dont understand how to read this TDR impedance graph...mainly the significance of this graph .
Kindly reply, I am really in need of help
Usman
I am simulating a multilayer semiconductor wave guide structure with metal on top in HFSS which is a straight wave guide as shown in picture 1.
I have to do impedance measurement using TDR but I dont understand how does it work. I am doing the interpolating sweep and normalizing the ports too which are the requirements to do TDR in HFSS (according to HFSS help).But is it the right way to do it?
Another question is that after normalization of port with 50 ohms the port impedance should be 50 on all the frequncies but in my simulation it jumps to 51.4 ohm at dc frequency i.e. 0.01 GHz
I am attaching both the TDR Impedance plot (measured using TDR) and also the port Impedance plot (after normalizing).
I dont understand how to read this TDR impedance graph...mainly the significance of this graph .
Kindly reply, I am really in need of help
Usman
Attachments
Last edited: