Continue to Site

Welcome to EDAboard.com

Welcome to our site! EDAboard.com is an international Electronics Discussion Forum focused on EDA software, circuits, schematics, books, theory, papers, asic, pld, 8051, DSP, Network, RF, Analog Design, PCB, Service Manuals... and a whole lot more! To participate you need to register. Registration is free. Click here to register now.

Help in plotting antenna Gain Vs Frequency in HFSS

Status
Not open for further replies.

fyp05

Newbie level 4
Joined
Jun 8, 2010
Messages
7
Helped
1
Reputation
2
Reaction score
1
Trophy points
1,283
Activity points
1,331
I am trying to plot antenna Gain Vs Frequency in HFSSv11.

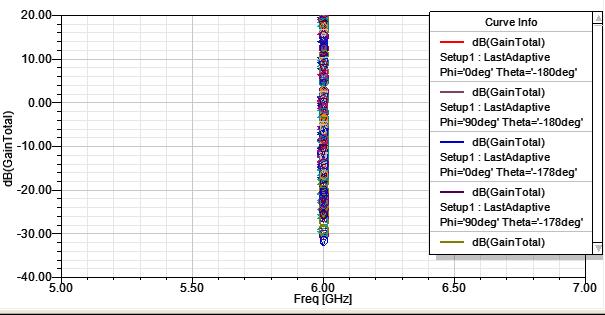
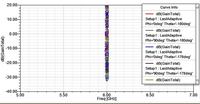
1. My problem is that when i use sweep to plot the graph hfss gives the option to plot the gain at the solution frequency only, while i need to plot the antenna gain over the entire frequency band of operation used in analyzing the antenna.The plot is also attached.plz help me find how to plot it over entire band of operation

2. Also Can someone tell me wat range of theta and phi should be used for the plot?


dear fyp05
i have a user's book for HFSS in V.10
maybe the answer of your Q can be found in that book.
just tell me, if you want that e-book, and i'll try to upload that user's book ASAP.

Best regards :)

Evyta
 
Hi fyp05,

You can easily plot the Gain vs Frequency using Hfss. Follow the following steps:

Go to HFSS-->Results-->create far field report-->rectangular plot

A new window will open up:

IN solution tab: select 'sweep1' or the name which you have given for the frequency sweep used for your antenna.
In Primarysweep tab: Select Freq, you can select on which frequency points you want to see the gain of your antenna by clicking at the corner of the tab in which 'All' is written,or if you will just select frequency it will by default take all the frequency points defined in your frequency sweep.
Click Families tab:
Theta: Choose appropriate value according to your antenna structure in which direction you want to see the gain of antenna.
Phi:Choose appropriate value according to your antenna structure in which direction you want to see the gain of antenna.

Then just plot and it will give you gain vs frequency plot as you wanted to see. IF you are having difficulty in picking the right values of 'Theta' and 'phi' at which to see the gain of antenna,post your file here and i will help you. IT is impossible to tell you without looking at your structure that which values of Theta and phi should be selected.

By looking at the graph you have attached, i am sure that you are not selecting the appropraite 'frequency sweep' in the solution tab,as a result HFSS is showing you the gain values on top of each other only at the solution frequency which in your case is 6GHz.

Hope it helps.

/SC
 
Thanku very much for the step by step description of the gain vs frequency plotting procedur,that helped alot.
 
dear fyp05
i have a user's book for HFSS in V.10
maybe the answer of your Q can be found in that book.
just tell me, if you want that e-book, and i'll try to upload that user's book ASAP.

Best regards :)

Evyta

I've been working with HFSS for a couple of months now... Can you upload the user book, it would be very useful? Thanks
 

Hi,
In Result -> Create Far Fields Report -> Rectangular Plot
in Solution: only setup1:LastAdaptive is found. Setup1:Sweep1 is not found.
So, not able to plot gain at all frequencies and can plot at only solution frequency.
Please reply me the solution.


Hi fyp05,

You can easily plot the Gain vs Frequency using Hfss. Follow the following steps:

Go to HFSS-->Results-->create far field report-->rectangular plot

A new window will open up:

IN solution tab: select 'sweep1' or the name which you have given for the frequency sweep used for your antenna.
In Primarysweep tab: Select Freq, you can select on which frequency points you want to see the gain of your antenna by clicking at the corner of the tab in which 'All' is written,or if you will just select frequency it will by default take all the frequency points defined in your frequency sweep.
Click Families tab:
Theta: Choose appropriate value according to your antenna structure in which direction you want to see the gain of antenna.
Phi:Choose appropriate value according to your antenna structure in which direction you want to see the gain of antenna.

Then just plot and it will give you gain vs frequency plot as you wanted to see. IF you are having difficulty in picking the right values of 'Theta' and 'phi' at which to see the gain of antenna,post your file here and i will help you. IT is impossible to tell you without looking at your structure that which values of Theta and phi should be selected.

By looking at the graph you have attached, i am sure that you are not selecting the appropraite 'frequency sweep' in the solution tab,as a result HFSS is showing you the gain values on top of each other only at the solution frequency which in your case is 6GHz.

Hope it helps.

/SC


---------- Post added at 14:19 ---------- Previous post was at 14:07 ----------

I need the gain vs frequency plot as shown in HFSS 13
https://obrazki.elektroda.pl/18_1328620715.jpg
Hi,
In Result -> Create Far Fields Report -> Rectangular Plot
in Solution: only setup1:LastAdaptive is found. Setup1:Sweep1 is not found.
So, not able to plot gain at all frequencies and can plot at only solution frequency.
Please reply me the solution.
 

Hi,
In Result -> Create Far Fields Report -> Rectangular Plot
in Solution: only setup1:LastAdaptive is found. Setup1:Sweep1 is not found.
So, not able to plot gain at all frequencies and can plot at only solution frequency.
Please reply me the solution.

First of all, you have to create a new 'Solution Setup' yourself.

Then follow the :

In Result -> Create Far Fields Report -> Rectangular Plot

And choose Sweep 1.

If you want to plot Gain against frequency, basically you are plotting a constant theta, and a constant phi over all frequencies.

Basically, choose one theta value and one phi value. And then sweep for all frequencies...then you can see the gain vs frequency correctly.

But, the chosen theta and phi must depend on you...what kind of antenna you design?

So my suggestion before you plot Gain vs Frequency, plot the 3D radiation pattern at the solution frequency, and observe which direction of phi and theta gives the best result.

Then just choose a constant phi and variables for theta ( 3 values enough). Then do the rectangular plot...

Try it yourself, don't depend on people spoon feeding u.
 
Then follow the :
Thanks for the reply friend. But my question is
"I already created solution frequency and added sweep to it. But the thing is , In Terminal solution data reports, i can find the SWEEP in solution
but in far field reports, i can find only LastAdaptive other than Sweeps in Solution.
Please find the following attachments for clear idea. I am using HFSS V13. Hope my question is clear to you now.
sweep in terminal solution data report.jpgfarfield reports.jpg
First of all, you have to create a new 'Solution Setup' yourself.

In Result -> Create Far Fields Report -> Rectangular Plot

And choose Sweep 1.

If you want to plot Gain against frequency, basically you are plotting a constant theta, and a constant phi over all frequencies.

Basically, choose one theta value and one phi value. And then sweep for all frequencies...then you can see the gain vs frequency correctly.

But, the chosen theta and phi must depend on you...what kind of antenna you design?

So my suggestion before you plot Gain vs Frequency, plot the 3D radiation pattern at the solution frequency, and observe which direction of phi and theta gives the best result.

Then just choose a constant phi and variables for theta ( 3 values enough). Then do the rectangular plot...

Try it yourself, don't depend on people spoon feeding u.
 

In older versions you have to select "Save Fields" in the sweep setup in order to plot the gain over the frequency. You should look for an option like this in your sweep setup.
 

Then follow the :
Thanks for the reply friend. But my question is
"I already created solution frequency and added sweep to it. But the thing is , In Terminal solution data reports, i can find the SWEEP in solution
but in far field reports, i can find only LastAdaptive other than Sweeps in Solution.
Please find the following attachments for clear idea. I am using HFSS V13. Hope my question is clear to you now.

I realise what your problem is now.

Your problem is first that you set up your Sweep 1 without the Save Fields ticked. Once you ticked that, you able to see your Sweep 1 in your far-field report. You can choose it then.

Also refer the below images, i attached. Sure you'll understand how to plot the gain vs frequency after viewing the images i screenshot for you.

Setting for sweeping:
Setting.jpg
Choosing Gain Plot vs Frequency
Sweep1.jpg
Sweep2.jpg
Choose your phi and theta values
Sweep3.jpg
 
*** pictures, frodonet. Thats exactly what i meant.
Without this option you can plot the reflection coefficients etc., but you cannot plot the farfield parameters.
 

*** pictures, frodonet. Thats exactly what i meant.
Without this option you can plot the reflection coefficients etc., but you cannot plot the farfield parameters.

Precisely buddy, i just posted pictures for better clarity. Actually we are talking about the same thing.

Cheers.
 

Hi Thanks for the reply
My Sweep Type is INTERPOLATING.
SAVE FIELDS option exist for only Discrete and Fast not for INTERPOLATING.
For INTERPOLATING sweep type, is there any way to plot the graph Gain vs Frequency?
I have one more doubt:
In Radiation pattern plot
E-Plane Co-Pol (rETheta-Phi-0 deg), Cross Pol(rETheta-Phi-90deg)
H-Plane Co-Pol(rEPhi-Phi-0 deg), Cross Pol(rEPhi-Phi-90 deg)
Are those right?


I realise what your problem is now.

Your problem is first that you set up your Sweep 1 without the Save Fields ticked. Once you ticked that, you able to see your Sweep 1 in your far-field report. You can choose it then.

Also refer the below images, i attached. Sure you'll understand how to plot the gain vs frequency after viewing the images i screenshot for you.

Setting for sweeping:
View attachment 69224
Choosing Gain Plot vs Frequency
View attachment 69225
View attachment 69226
Choose your phi and theta values
View attachment 69227
 

It seems you can't use the interpolating sweep to calculate the fields.
However, you can setup two sweeps, the interpolating sweep and a fast sweep. You could compare the S-Parameter results of both sweeps. And if the they are the same you probably can trust the fast sweep results from which you can calculate the gain.
And to justify the results a bit more, you could use a discrete sweep with very vew points and check if the results match with the results from the fast sweep.
 

Please open a new thread for a new topic!
 

Status
Not open for further replies.

Part and Inventory Search

Welcome to EDABoard.com

Sponsor

Back
Top