powersys
Advanced Member level 1
I encounter the following problem. Kindly advise.
Fig0 -> Configuration Parameters
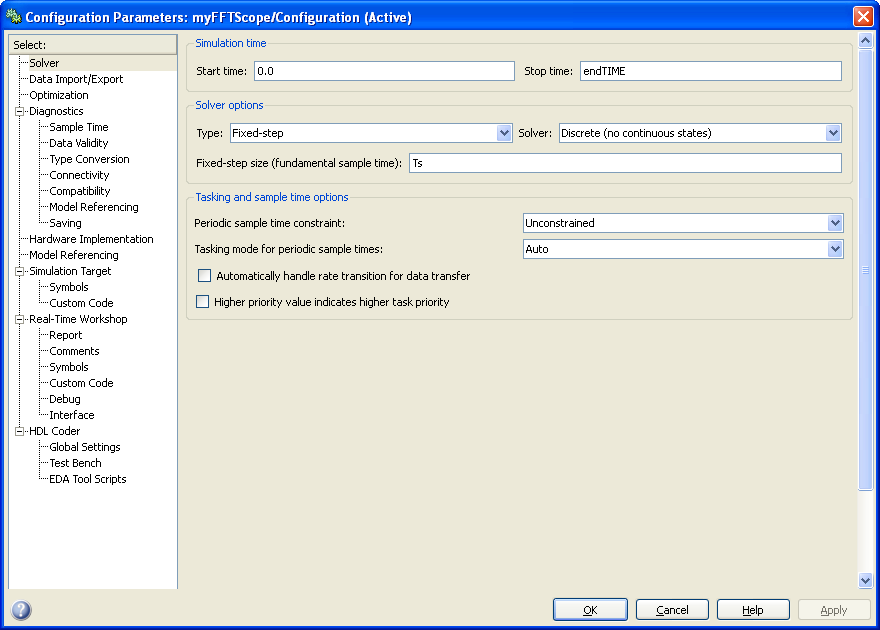
Fig1 -> Simulink model
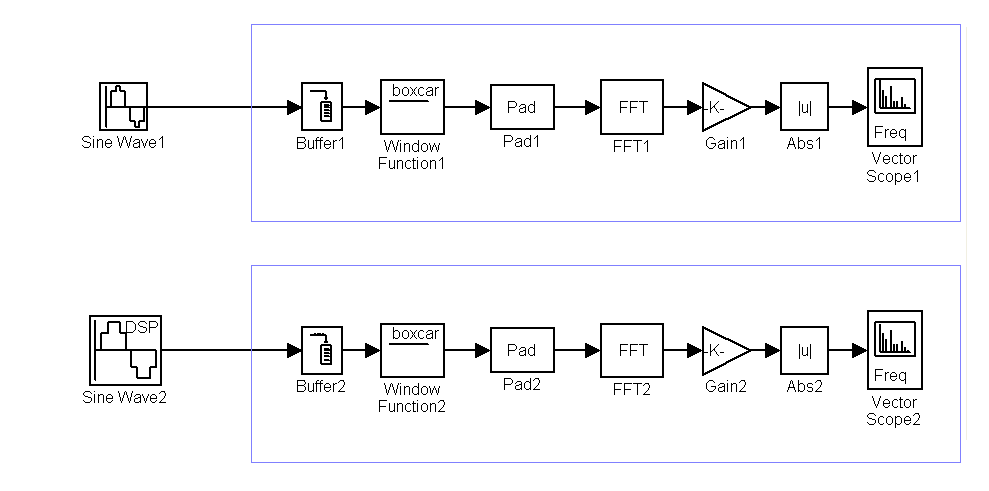
Fig2 -> Source Block Parameters: "Sine Wave1" & "Sine Wave2".
"Sine Wave1" and "Sine Wave2" are configured to have similar amplitude, frequency, phase, and sample time.
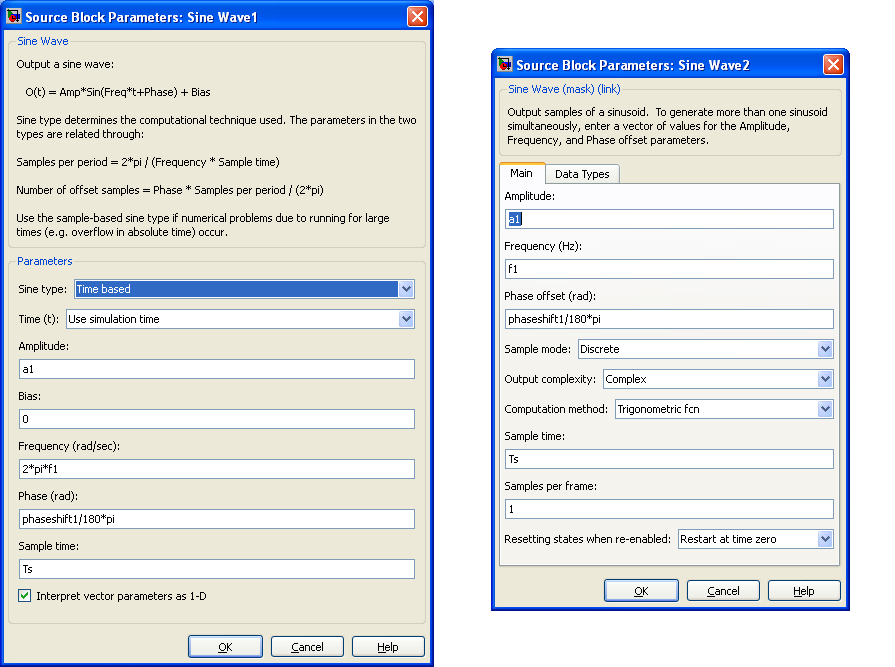
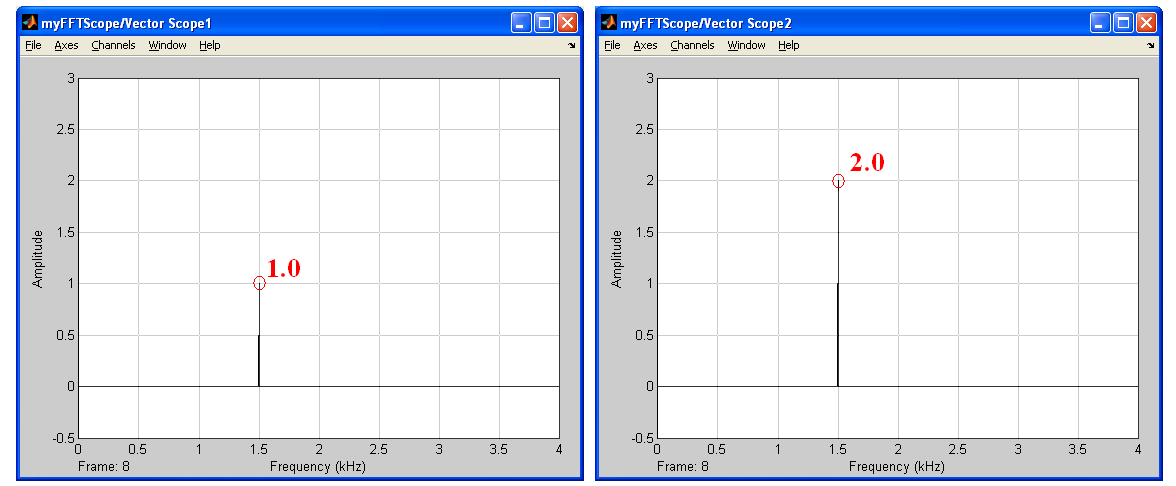
Fig3 -> Output of "Vector Scope1" and "Vector scope2"
Questions:
[1] "Vector Scope1" shows peak=1.0V at 1.5kHz, whilst "Vector Scope2" shows peak=2.0V at 1.5kHz. Why do they have different peak magnitudes at 1.5kHz?
[2] It looks to me that the outputs of "Sine Wave1" and "Sine Wave2" are different. Why?
Thanks
Fig0 -> Configuration Parameters
Fig1 -> Simulink model
Fig2 -> Source Block Parameters: "Sine Wave1" & "Sine Wave2".
"Sine Wave1" and "Sine Wave2" are configured to have similar amplitude, frequency, phase, and sample time.
Fig3 -> Output of "Vector Scope1" and "Vector scope2"
Questions:
[1] "Vector Scope1" shows peak=1.0V at 1.5kHz, whilst "Vector Scope2" shows peak=2.0V at 1.5kHz. Why do they have different peak magnitudes at 1.5kHz?
[2] It looks to me that the outputs of "Sine Wave1" and "Sine Wave2" are different. Why?
Thanks
Code:
%%% Global Parameters
endTIME=1;

bufferSIZE=1024;
fftLENGTH=1024;

fs=8e3;
Ts=1/fs;

a1=1;
f1=1500;
phaseshift1=0;


%%% Function Block Parameters: Buffer1 (Buffer2)
Output buffer size: bufferSIZE
Buffer overlap: 0
Initial conditions: 0


%%% Function Block Parameters: Pad1 (Pad2)
Pad over: Columns
Pad value source: Specify via dialog
Pad value: 0
Output column mode: User-specified
Column size: fftLENGTH
Action when truncation occurs: None


%%% Function Block Parameters: FFT1 (FFT2)
Main -> Twiddle factor computation: Table lookup
Optimize table for: Speed
Output in bit-reversed order: unchecked
Divide butterfly outputs by two: unchecked
Inherit FFT length from input dimensions: unchecked
FFT length: fftLENGTH


%%% Function Block Parameters: Gain1 (Gain2)
Gain: 2/fftLENGTH
Multiplication: Element-wise(K.*u)
Sample time: -1


%%% Sink Block Parameters: Vector Scope1 (Vector Scope2)
Under "Axis Properties" tab:
Frequency units: Hertz
Frequency range: [0...Fs/2]
Inherit sample time from input: checked
Frequency display limits: Auto
Amplitude: Magnitude
Minimum Y-limit: -0.5
Maximum Y-limit: 3
Y-axis title: Amplitude")