Continue to Site

Welcome to EDAboard.com

Welcome to our site! EDAboard.com is an international Electronics Discussion Forum focused on EDA software, circuits, schematics, books, theory, papers, asic, pld, 8051, DSP, Network, RF, Analog Design, PCB, Service Manuals... and a whole lot more! To participate you need to register. Registration is free. Click here to register now.

How to plot this graph at MATLAB

Status
Not open for further replies.

kseng2002

Member level 2
Joined
Aug 27, 2004
Messages
51
Helped
0
Reputation
0
Reaction score
0
Trophy points
1,286
Location
Malaysia
Activity points
467
plot graph in matlab

Untitled.jpg


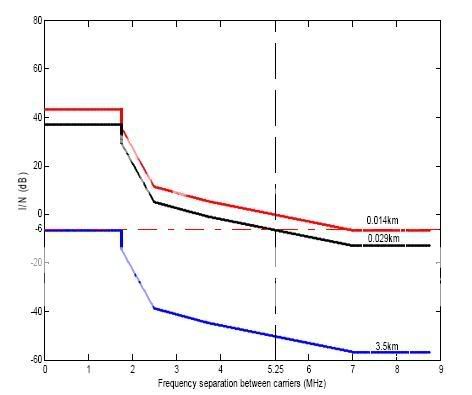
How do i plot this type of graph at MATLAB ? Pls advice !!!!! Thx in advance ~~~ Urgent !

There in no equation for this graph, only got x,y value. Pls advice how to plot !!!!!!!!!!!
 

matlab plot graph

i think u can draw some equation from there using the equation of a line between two points(sory for my english) this is something like that:

(x-x1)/(x2-x1)=(y-y1)/(y2-y1)

for example for RED function :
between 0MHz and ~1.8MHz ==> y=45
---
i think with this u will have a starting point
 

    kseng2002

    Points: 2
    Helpful Answer Positive Rating
how to plot graph in matlab

Thx for your suggestion :!: After get the starting point, how to continue for the rest of the line :?: Pls advice, thanks in advance !
 

how to plot a graph in matlab

between 1.8Mhz and ~~~2.5Mhz u will have ~this eq:
(x-1.8Mhz)/(2.5MHz-1.8Mhz)=(y-38)/(15-38)
and result is y=f(x) this is for red one
....
 

Status
Not open for further replies.

Similar threads

Part and Inventory Search

Welcome to EDABoard.com

Sponsor

Back
Top