Continue to Site

Welcome to EDAboard.com

Welcome to our site! EDAboard.com is an international Electronics Discussion Forum focused on EDA software, circuits, schematics, books, theory, papers, asic, pld, 8051, DSP, Network, RF, Analog Design, PCB, Service Manuals... and a whole lot more! To participate you need to register. Registration is free. Click here to register now.

FUNNY B-H curve... pls advise!!!

Status
Not open for further replies.

powersys

Advanced Member level 1
Joined
Nov 29, 2005
Messages
439
Helped
3
Reputation
6
Reaction score
2
Trophy points
1,298
Activity points
4,981
epcos ferrite bh n27

I’ve constructed and tested the B-H Test Circuit found in the following website:
http://www.ee.surrey.ac.uk/Workshop/advice/coils/BH_measure.html
However, the B-H plot measured when the current is high looks funny (see Figure 5). Would you pls advise why this happened?

Figure 1 shows the B-H test circuit, whilst Figures 2(a) and 2(b) show the B-H curves measured using the circuit when the current Ip flowing in primary coil (22 turns) are low and high respectively. Both B-H curves were copied from the website.

Figure 3 shows the toroidal core used in my experiment. Part# is B64290L618X27 from Epcos. The dimensions are 25.3 x 14.8 x 10. The material of the core is N27. The number of turns used for primary coil is 22 turns, and the number of turns used for secondary is 25 turns.

Figure 4(a) shows the waveforms of Ip (Ch1) and Vo (Ch2). Figure 4(b) shows the X-Y plot of both signals. The current Ip flowing through primary coil is around 0.2A pk-pk.

Figure 5(a) shows the waveforms of Ip (Ch1) and Vo (Ch2). Figure 5(b) shows the X-Y plot of both signals. The current Ip flowing through primary coil is around 0.6A pk-pk. Obviously, the X-Y plot looks funny when the current is high (e.g. has one big loop and two small loops). Would you please advise why this happened? Please suggest the solutions to solve the problem so that the X-Y plot will look like Figure 2(b).

Thank you very much


32_1173447623.jpg

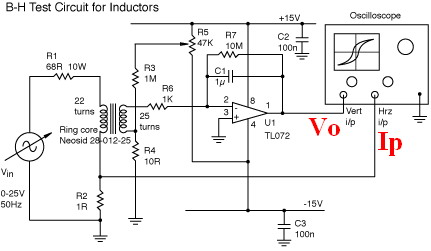
Figure 1: B-H Test Circuit


78_1173447951.jpg

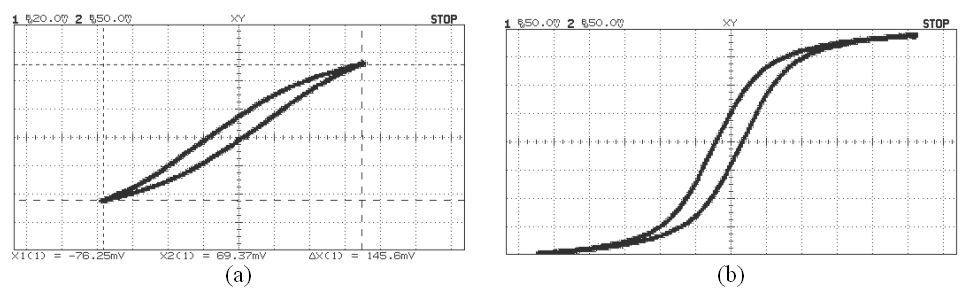
Figure 2: B-H curve with – (a) low primary current, and (b) high primary current.
(Both plots were copied from the website)


32_1173447970.jpg

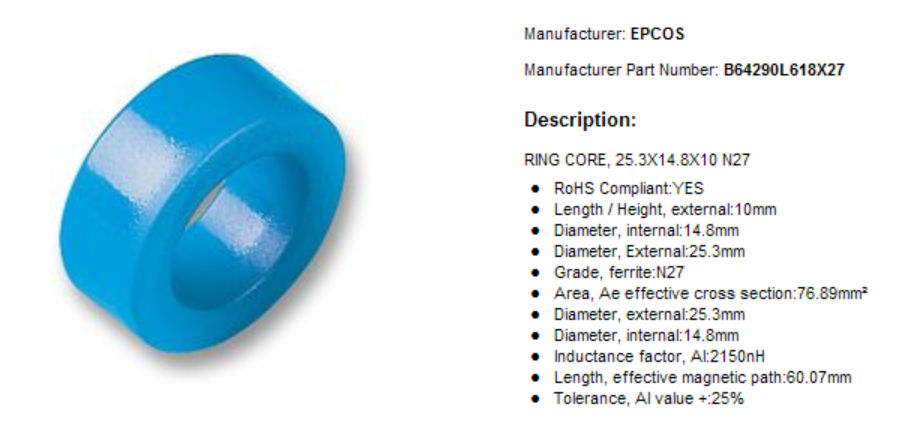
Figure 3: Toroidal core used in my experiment


94_1173448013.jpg

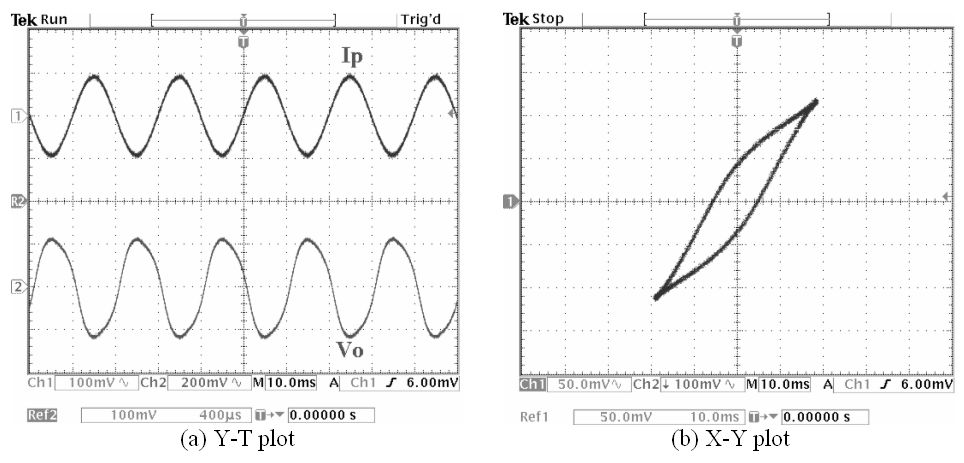
Figure 4: Current in primary coil, Ip (pk-pk) is around 0.2A


97_1173449102.jpg
[/
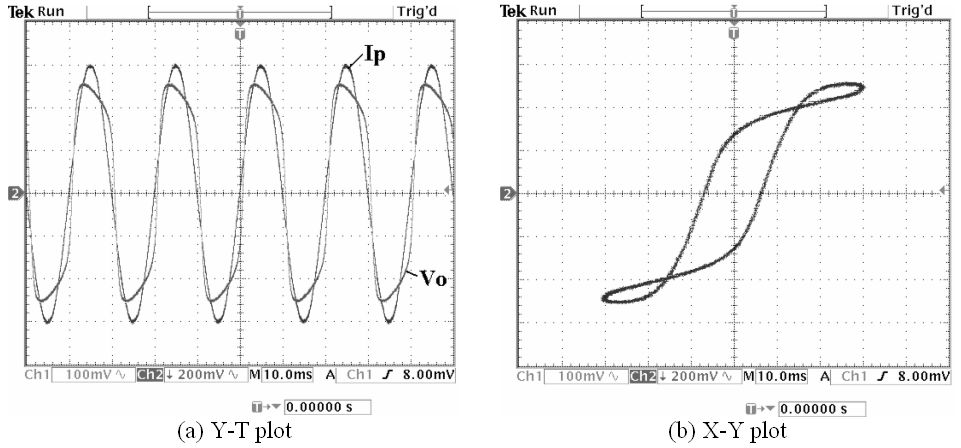
Figure 5: Current in primary coil, Ip (pk-pk) is around 0.6A
 

question is a real ciruit or just a simulation ..I see no load on the Op amp output!
 

eltonjohn said:
question is a real ciruit or just a simulation ..I see no load on the Op amp output!
It's not simulation, but real circuit. Do u mean to connect a resistor between the opamp output and GND? Thanks.
 

The saturation appears when most of fine grains are aligned.
 

yjkwon57 said:
The saturation appears when most of fine grains are aligned.
I know... but both ends of the bh-loop have small loop, which is not available in bh-loop published by manufacturer or in textbook. How to get rid of the small loops? Is it cost by the circuit?
 

Hi, powersys.

One thing strange is that Vo and Ip should be almost in phase according to the circuit, I think. In Fig. 4, two signals shows 180 phase difference in Y-T plot, but, shows 0 phase difference in X-Y plot. In Fig. 5, they are almost in phase in both Y-T and X-Y plots. Anyway, in the experiment using a small current shows a small distortion in Vo compared to the distortion in Vo in the experiment using a small current. Thus, I think there are some interferences in the circuit, which caused the small loops at the end of the bh-loop.

Good luck to you!
 

    powersys

    Points: 2
    Helpful Answer Positive Rating
yjkwon57 said:
Hi, powersys.

One thing strange is that Vo and Ip should be almost in phase according to the circuit, I think. In Fig. 4, two signals shows 180 phase difference in Y-T plot, but, shows 0 phase difference in X-Y plot. In Fig. 5, they are almost in phase in both Y-T and X-Y plots. Anyway, in the experiment using a small current shows a small distortion in Vo compared to the distortion in Vo in the experiment using a small current. Thus, I think there are some interferences in the circuit, which caused the small loops at the end of the bh-loop.
Good observation... I agree with you that Y-T and X-Y plots in Fig. 4 should be almost in phase. For your information, the slope of the b-h loop was 'negative' initially. Then, I 'invert' the signal at ch2 or Vo to get the b-h loop with 'positive' slope. Probably I forget to set the 'invert' on when measured the Y-T signal. Actually I should swap the terminals of the secondary winding. I will try it out next week. Thanks.
 

Just for reference... Figure 1.18 and Figure 1.19 were copied from the text by P. C. Sen. iΦ1 shown in Figure 1.18 is the fundamental component of the exciting current iΦ that lags the voltage e (or Vin in my circuit) by 90°.

Pls refer to the Y-T plot (Vo vs Ip, where Vo represents Φ). It's noted that Ip is not distorted but Vo is distorted. However, the exciting current iΦ is found distorted and Φ not distorted in both Figures 1.18 and 1.19. Which one is correct? My experiment results or those copied from Sen's text? Pls advise.

Actual text regarding Figures 1.18 and 1.19:
13_1174567962.gif


51_1173630392.jpg


29_1173630432.jpg
 

In Fig. 1.18 of the reference book, i_m should be much larger than i_c, if it can be used as an inductor/transformer. Thus, one thing to be noted is that, although some distortion is formed, the peak of Vo is (almost) in phase with the peak of i_pi, which will not introduce some small loops at both ends of the B-H curve. In Fig. 1.19 (c) of the reference book, if e is a sine-wave voltage signal, i_m as well as i_pi, representing Ip in your circuit, should be sinusoidal. But, i_m1, contributing to the effective magnetic flux and representing Vo in your circuit, will not be sinusoidal. In Fig. 1.19 (a) of the reference book, Pi is selected as a sine wave, but, in your circuit, Io is selected as a sine wave. Thus, both are correct. The difference is the different selection of the reference sine-wave signals, I think.
 

yjkwon57 said:
In Fig. 1.18 of the reference book, i_m should be much larger than i_c, if it can be used as an inductor/transformer. Thus, one thing to be noted is that, although some distortion is formed, the peak of Vo is (almost) in phase with the peak of i_pi, which will not introduce some small loops at both ends of the B-H curve. In Fig. 1.19 (c) of the reference book, if e is a sine-wave voltage signal, i_m as well as i_pi, representing Ip in your circuit, should be sinusoidal. But, i_m1, contributing to the effective magnetic flux and representing Vo in your circuit, will not be sinusoidal. In Fig. 1.19 (a) of the reference book, Pi is selected as a sine wave, but, in your circuit, Io is selected as a sine wave. Thus, both are correct. The difference is the different selection of the reference sine-wave signals, I think.
Would u pls advise what are 'Pi' and 'Io' in your reply?

I still feel that somethings wrong in Figure 1.18 and Figure 1.19. In my opinion, the Ip should be 'always' in sinusoidal, and the flux (which is represented by Vo in my circuit) will be distorted when the core is saturated due to high MMF, which is proportional to Ip. What's your opinion?

Thanks.
 

Pi in Fig. 1.18 of the reference book is the magnetic flux represented by the biggest solid line with a sequence number circles, and the i_pi in Fig. 1.18 (a) is equivalent to Ip in your circuit. You said Ip should be always sinusoidal. That is absolutely right in your experiment with your circuit. But, the magnetic flux is not proportional to Ip, which is not explained in the reference book. The magnetic flux is proportional to a current component depicted as i_pi1 in Fig. 1.18 (a) and i_m1 in my previous explanation. I used the symbol i_m1 just as i_pi1 in the reference book. The coupling magnetic flux will be distorted and the Vo also will be distorted in your experiment. Restating my previous description, in Fig. 1.19 (c) of the reference book, if e is a sine-wave voltage signal as in your experimental situation, i_m as well as i_pi represented as Ip in your circuit, should be sinusoidal. But, i_m1, contributing to the effective magnetic flux and represented as Vo in your circuit, will not be sinusoidal. If Pi in Fig. 1.18 and Fig. 19 of the reference book is to be sinusoidal, e in the same figure is not to be sinusoidal, i.e., to be distorted. Thus, I think e curve might be modified.
 

yjkwon57 said:
Pi in Fig. 1.18 of the reference book is the magnetic flux represented by the biggest solid line with a sequence number circles, and the i_pi in Fig. 1.18 (a) is equivalent to Ip in your circuit. You said Ip should be always sinusoidal. That is absolutely right in your experiment with your circuit. But, the magnetic flux is not proportional to Ip, which is not explained in the reference book. The magnetic flux is proportional to a current component depicted as i_pi1 in Fig. 1.18 (a) and i_m1 in my previous explanation. I used the symbol i_m1 just as i_pi1 in the reference book. The coupling magnetic flux will be distorted and the Vo also will be distorted in your experiment. Restating my previous description, in Fig. 1.19 (c) of the reference book, if e is a sine-wave voltage signal as in your experimental situation, i_m as well as i_pi represented as Ip in your circuit, should be sinusoidal. But, i_m1, contributing to the effective magnetic flux and represented as Vo in your circuit, will not be sinusoidal. If Pi in Fig. 1.18 and Fig. 19 of the reference book is to be sinusoidal, e in the same figure is not to be sinusoidal, i.e., to be distorted. Thus, I think e curve might be modified.
I have pasted the actual text (describing Figures 1.18 and 1.19) frm the reference book above. May be it could help for our discussion here. Thanks.
 

powersys said:
yjkwon57 said:
In Fig. 1.18 of the reference book, i_m should be much larger than i_c, if it can be used as an inductor/transformer. Thus, one thing to be noted is that, although some distortion is formed, the peak of Vo is (almost) in phase with the peak of i_pi, which will not introduce some small loops at both ends of the B-H curve. In Fig. 1.19 (c) of the reference book, if e is a sine-wave voltage signal, i_m as well as i_pi, representing Ip in your circuit, should be sinusoidal. But, i_m1, contributing to the effective magnetic flux and representing Vo in your circuit, will not be sinusoidal. In Fig. 1.19 (a) of the reference book, Pi is selected as a sine wave, but, in your circuit, Io is selected as a sine wave. Thus, both are correct. The difference is the different selection of the reference sine-wave signals, I think.
Would u pls advise what are 'Pi' and 'Io' in your reply?

I still feel that somethings wrong in Figure 1.18 and Figure 1.19. In my opinion, the Ip should be 'always' in sinusoidal, and the flux (which is represented by Vo in my circuit) will be distorted when the core is saturated due to high MMF, which is proportional to Ip. What's your opinion?

Thanks.
I think my comment (highlighted in red) is wrong. The correct one should be: Ip will be distorted when the core is saturated.
 

Hi, powersys.

But, in your experimental circuit, Ip shold be sinusoidal. Analyzing the circuit based on the electronics, Ip should be sinusoidal to my knowledge.
 

yjkwon57 said:
Hi, powersys.

But, in your experimental circuit, Ip shold be sinusoidal. Analyzing the circuit based on the electronics, Ip should be sinusoidal to my knowledge.
Hi yjkwon57,
Let's assume there is only primary winding on the toroidal core, and Ip is the current flowing in the winding. In my opinion, when the core starts to get saturated, the permeability of the magnetic circuit, and hence the inductance of the electric circuit, will drop. If the inductance is lower, the reactance (jwL) will be less also and therefore, higher current will flow. What do u think?
 

Hi, powersys.

We are condidering a steady-state circuit solution rather than a step-input response. In your circuit, we are watching a steady-state response of your experimental circuit.

Added after 2 minutes:

In the reference book, the author also tries to solve the circuit to get a steady-state picture.
 

yjkwon57 said:
Hi, powersys.

We are condidering a steady-state circuit solution rather than a step-input response. In your circuit, we are watching a steady-state response of your experimental circuit.

Added after 2 minutes:

In the reference book, the author also tries to solve the circuit to get a steady-state picture.
But the Vin is an AC power supply, and jwL counts, right? Pls correct me if I'm wrong. Thanks.
 

That's right. In a steady-state, The reactance of an inductance is reduced to jwL. You can solve it easily by using phasors.
 

yjkwon57 said:
Hi, powersys.

But, in your experimental circuit, Ip shold be sinusoidal. Analyzing the circuit based on the electronics, Ip should be sinusoidal to my knowledge.
Did u mean Ip should be ALWAYS sinusoidal? Pls enlighten me how did u come to this conclusion... Thanks.
 

Hi, powersys.

The loop including the secondary coil of the transformer is as follows: secondary coil - 1 K resistance - (10 M resistance - parallel - 1 uF capacitance) - 10R.
Since the reactance seen into the primary coil is independent of the permeability, i.e., the current flowing through the transformer, it will have a fixed reactance. Thus, since the voltage source in the primary loop is sinusoidal, the current flowing through the primary coil is sinusoidal.
Then, the voltage across the second coil can be obtained. But, it is evident that it is proportional to the permeability of the toroidal core, which is dependent of the current, i.e., is a function of time. Thus, the voltage is to be distorted.
 

Status
Not open for further replies.

Part and Inventory Search

Welcome to EDABoard.com

Sponsor

Back
Top