Continue to Site

Welcome to EDAboard.com

Welcome to our site! EDAboard.com is an international Electronics Discussion Forum focused on EDA software, circuits, schematics, books, theory, papers, asic, pld, 8051, DSP, Network, RF, Analog Design, PCB, Service Manuals... and a whole lot more! To participate you need to register. Registration is free. Click here to register now.

how to plot the VSWR in ADS software

Status
Not open for further replies.

antennadesign54321

Member level 1
Joined
Nov 14, 2010
Messages
34
Helped
1
Reputation
2
Reaction score
0
Trophy points
1,286
Activity points
1,530
Hey,
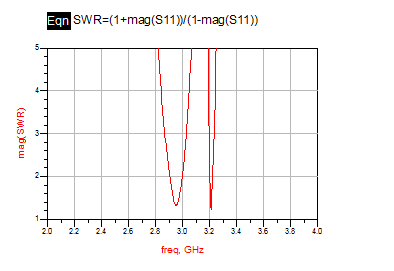
Do can we plot the VSWR chart for various frequencies in ADS , say for analysing the results for a Microstrip antenna. and what are considered the good values of VSWR
 

Hi antennadesign

I believe you can plot the VSWR in almost all of the simulation softwares including,that is what they are meant for.What are considered good values of vswr, answer would be depends but normally speaking 2:1 is a considered good.

Hope that Helps

Regards
Rotmanlens.
 
Hi,

in this toolbar (left side) you will find under S-Paramer simulation a tool called VSWR. It automatically calculates the VSWR from s-parameters. For further information use help function. VSWR should be in ideal case 1

Regards
 

Here's a nice page with the equations relating impedance, VSWR and return loss.
**broken link removed**

Most RF systems are assumed to be very well matched at anything better than a 20 dB return loss (1.22:1 SWR). A decent match is considered to roughly be at least a 10 db return loss (1.92:1 SWR). Anything below 10 dB is usually considered poor. For a narrowband antenna, you can get good return loss/VSWR numbers at your operating frequency. If you make a broadband antenna, the return loss often suffers in order to make an acceptable design over a wide freq range.

For reference, a 10 dB return loss is equivalent to having 10% of the energy you put into a load be reflected back to the source, due to the impedance mismatch. A 20 dB return loss is equivalent to having 1% of the energy be reflected by the load mismatch.

As for plotting, I think you can use swr(S(1,1)) or vswr(S(1,1)) in the Data Display to have it plot that from the S-parameter data. As mentioend before, there is also the VSWR block (under S-parameters toolbox?) that can be added to the simulation. This just does that computation for you and stores it into the dataset, but its really handy when you want to use it as a goal measurement for circuit optimization.
 
Thanks all for your response, It was helpful. But when i check my ADS 2009, Under the "Simulation-S_Param" i only have 1 tool i.e "OSC test" , I dont see any VSWR tool on it. Any idea why is it so ?
 

Hi Johnjoe & Enjunear,
I checked , I can see the VSWR under simulation in the Schematic Window, But i have designed the antenna in the layout window directly , and i dont see the VSWR option in the Layout Window , Wht can be done to resolve this issue,Can i also see the Gain?
 

    V

    Points: 2
    Helpful Answer Positive Rating
You can define an equation in the data display: VSWR = (1+mag(S11))/(1-mag(S11))

5_1326442519.png


edit: It is even simpler. You can also use the vswr function that enjunear has pointed to: vswr(s11)
 
Last edited:
Hi Volker,
Yes, i used the formula y=vswr(S11) in the Eqn and it works fine.

I wanted to plot the Gain of the microstrip antenna which i have created in ADS Layout, I want Gain V/s Frequency plot, Can you please let me know how can i get it . becuase i only see GAIN in the schematic window and not in layout.?

Also, I want to see the 2 dimensional View of the radiation pattern in ADS , I can see the 3 Dimensional but not 2 dimensional. When i select 2 dimensional, i get Linear,Circular,Absolute,Power POLARIZATION , but not the 2D Radiattion pattern.

Many thanks.
 

I wanted to plot the Gain of the microstrip antenna which i have created in ADS Layout, I want Gain V/s Frequency plot, Can you please let me know how can i get it .

I have no idea how to implement that (for each frequency, sweep over all theta and phi to find the maximum antenna gain, and then plot that max value vs. frequency)

Have you tried to ask Agilent support?

becuase i only see GAIN in the schematic window and not in layout.?

I think this "GAIN" results that you see for circuit simulation has nothing to do with antenna gain.

Also, I want to see the 2 dimensional View of the radiation pattern in ADS , I can see the 3 Dimensional but not 2 dimensional. When i select 2 dimensional, i get Linear,Circular,Absolute,Power POLARIZATION , but not the 2D Radiattion pattern.

Have you looked at the antenna examples that ship with ADS? I don't have a Momentum license, but when I look at the examples they have 2D antenna pattern in the data display.
 

I wanted to plot the Gain of the microstrip antenna which i have created in ADS Layout, I want Gain V/s Frequency plot, Can you please let me know how can i get it . becuase i only see GAIN in the schematic window and not in layout.?

I don't know of any way to generate a plot like that with ADS Momentum. I know other apps like CST have features like that, but have only seen them in presentation, not actually done them personally. You could always go about it the long way (generate the antenna gain plot at one frequency, identify the peak value, record on paper, repeat, then plot values in Excel, etc).

Also, I want to see the 2 dimensional View of the radiation pattern in ADS , I can see the 3 Dimensional but not 2 dimensional. When i select 2 dimensional, i get Linear,Circular,Absolute,Power POLARIZATION , but not the 2D Radiattion pattern.

I'm not familiar with that dialog box, but it sounds like it's asking you for which type of plot you want, specifically:
Linear - Gain assuming linear polarization
Circular- Gain assuming circular polarization
Absolute - Absolute magnitude of gain
Power - Power gain
POLARIZATION - plot of polarization trend (vertical, horizontal, elliptical, circular, etc).
My suggestion, use the ADS help menu and see what it tells you about those plot types. ADS's help is quite full of good information.

I'd wager that Absolute or Power will give you want you want, assuming you pick the right 2D "slice" to look at. I'd plot your 3D radiation pattern, note a few key points (peak gain on main lobe, approximate gain of side lobes, etc). Then, run your 2D plot and find the one that matches those values. Then you should have correlation between the 3D gain plot and your selected 2D plot.
 

Hey Enjunear & Volker,
thankyou both you for time and efforts. Much appreciated.

Last thing. I have got all my results & ready to write paper now. I wanted to check with you if you have any knowledge which is the best tool to draw the Microstrip antenna in 2D ( Side View & Front View) for the paper ( as you must have seen on many papers).
 

I usually just take a screenshot from the ADS layout tool and/or the 3D radiation pattern for any reports/presentations/etc. You could use the layout tool, turn of polygon fill for the cond layer, then add some dimension lines to show the critical measurements of your antenna design. What you are talking about is more of a CAD drawing, and that's not something I have much background with.
 

Status
Not open for further replies.

Part and Inventory Search

Welcome to EDABoard.com

Sponsor

Back
Top